In short
A vineyard decision starts at a desk and gets checked in the rows, and many agritech products lose it on the way: the phone shows a different map, the imagery date disappears, an offline note looks synced when it isn't, and field data slips into the estimate unreviewed. Follow one illustrative block from the grower's estimate to the worker's route and back, and see what each screen has to carry so the number stays honest.
In this article
- The example we follow
- Name the shared object before you design a screen
- At the desk: decide which input can change, and who changes it
- The handoff: one map, not a second one
- In the rows: when the phone and the plan disagree
- No signal: four states an observation can be in
- Back at the desk: review before the model sees it
- What we designed for VineView, and what we didn’t
- Test the whole trip with a grower and a worker
- Where to start
To hand a vineyard estimate and sampling route to a field worker without losing context, the phone has to carry the same object the desk was looking at: season, block, zone polygon, imagery date, the source of every input and the route itself. In the rows it must show where the worker is against where the plan says they should be, keep an offline observation visibly separate from a synchronized one, and send that observation back to the grower as a proposal, not as a silent change to the estimate. Miss any of those and the desk and the field are no longer talking about the same vines.
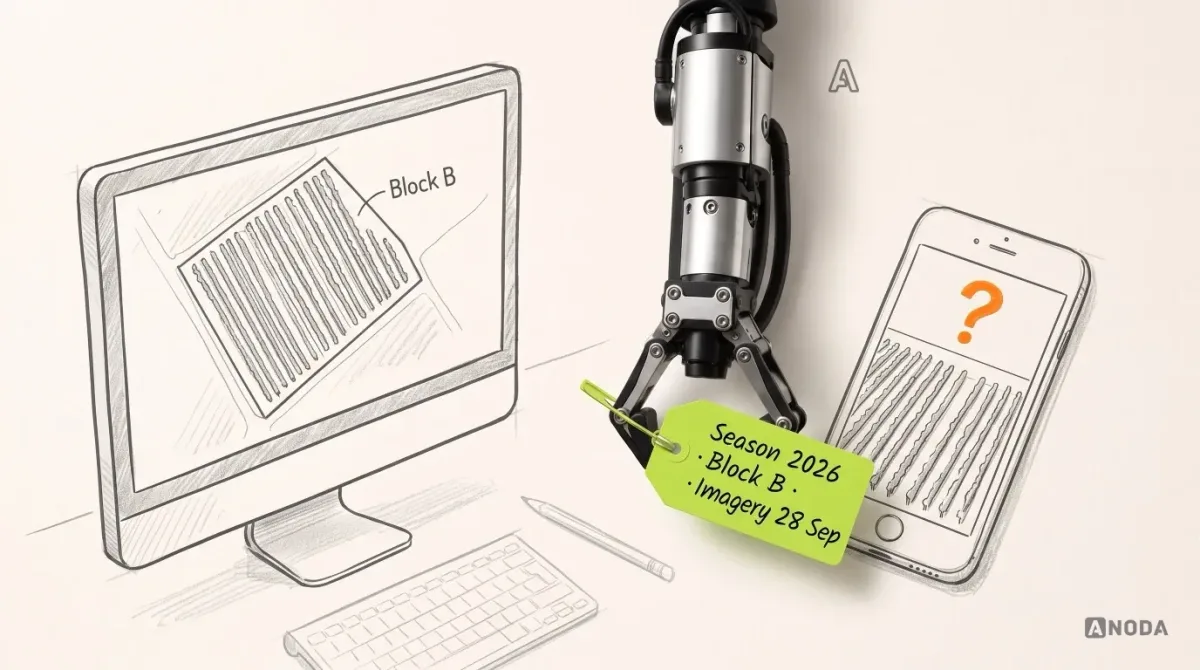
Here is the usual mess. The grower adjusts an estimate on a big screen with imagery, history and a model behind it. The worker gets a pin on a phone map and no idea which season, imagery or question the walk is for. The observation comes back as a number with no date, zone or status. Then somebody types it into the estimate.
Every ingredient is labelled correctly. The data is fine. The handoff is half-baked.
Agritech is not short of clever technology: drones, imagery, models, and now AI that promises to read the vines for you. None of it fixes a phone that forgets which block it is in. The vines are new; the problem is the oldest one in product design.
The example we follow
To keep this concrete, one connected example runs through the article. It is illustrative: the block, dates, zones and transitions are invented, and nothing here implies a yield improvement or the accuracy of any algorithm.
A grower opens Season 2026, Block B. The aerial imagery behind it is dated 28 September. The block has an estimate produced by the client’s own model from imagery, productive-vine counts and historical values. Something in the history looks off, so the grower wants a field check before trusting the number. A worker receives Route B on a phone, finds the phone placing them in a different zone from the planned one, records an observation without signal, sees it waiting, then synchronized. Back at the desk, the grower reviews the changed input before anything is recalculated.
Name the shared object before you design a screen
The first decision is not a layout. It is what exactly travels between desk and field. If the team can’t write it down, each screen fills the gaps with its own guess. For our example:
| Part of the object | Illustrative value | Why it has to travel |
|---|---|---|
| Season | 2026 | Block B in 2025 is a different set of decisions on the same vines |
| Block | Block B | The unit the estimate belongs to |
| Zone and polygon | Zone 4, drawn on the block | Where the observation is supposed to come from |
| Imagery date | 28 September | Tells everyone how old the picture of the vines is |
| Estimate and its source | Client model, from imagery, vine counts and history | Separates a calculated number from a measured one |
| Route | Route B | The order the worker walks the sample points in |
| Observation status | Draft, submitted and waiting, synchronized, conflict | Says whether the field result exists anywhere but the phone |
The most important line in that table is the difference between an estimate and an observation. An estimate is the cookbook saying forty minutes. An observation is the skewer that came out of the cake clean, or didn’t. Both are useful. Treat one as the other and you serve raw dough with total confidence.
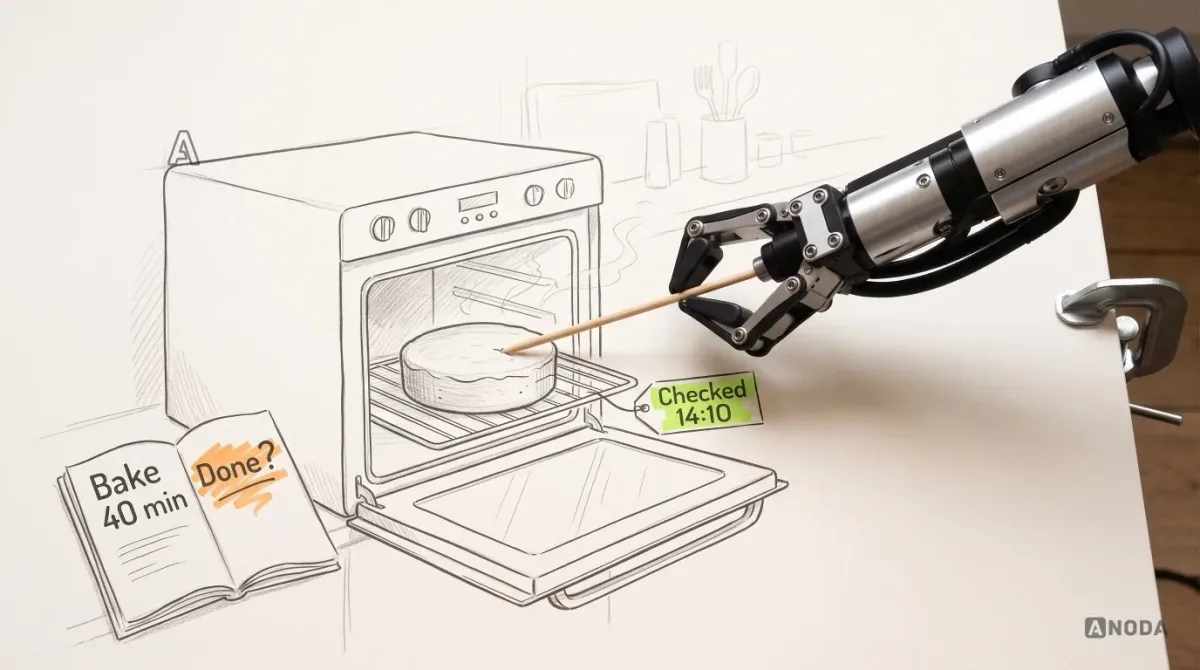
So the estimate never wears the same clothes as a measured value. Label its source, show which inputs fed it and keep field observations in their own category until someone decides to use them. A grower who can’t tell calculated from counted stops trusting both and goes back to the notebook in the truck. You paid to acquire that customer. The notebook didn’t.
At the desk: decide which input can change, and who changes it
Before touching the estimate, the grower inspects what it stands on: block history, earlier seasons’ inputs, the imagery date, what the model used. An adjustment made without that view is a guess with a decimal point.
The harder question is ownership. Several hands touch the number: the grower, a viticulturist or agronomist, the platform’s model. Let anyone change anything and you get three people seasoning one pot, nobody tasting, and no record of who added which pinch.
Design the desk view so each input answers three questions on screen:
- Where did it come from? Model output, imagery-derived count, manual count, historical value or a manual adjustment.
- Who may change it? In our example (illustrative rule), the grower can apply an adjustment and request a field check, but the model’s own output is read-only and the agronomist signs off on changes to historical values.
- What does changing it affect? Which totals recalculate, and whether the change is visible to anyone else.
That last point is cold money logic. In a typical operation, an estimate feeds real planning: crews, bins, transport, buyers. A number that moved quietly costs more than one that is wrong in plain sight, because nobody knows to question it.
Periods, freshness, filters and states on an analytical screen are their own subject, covered in our dashboard design process. Here the desk view has one job: show the block clearly enough to decide whether to send someone into it.
The handoff: one map, not a second one
Now the grower sends the work out. This is where many products quietly fork the truth.
The desk has a carefully drawn block with zones and polygons. The phone gets a list of points on a generic map, sometimes with different boundaries, often without the block name. It’s like reading a recipe to a friend over the phone and letting them convert grams to cups by eye. Everything they cook is technically from your recipe. Nothing comes out the same.
The rule is simple to say and annoying to design: the phone shows the same object, not a copy of it. In our example the worker’s screen opens on Route B inside Block B, Season 2026, with the same polygon for Zone 4 the grower saw at the desk, the same name, and the imagery date in plain sight. If the imagery is old for the question being asked, the phone says so, so the worker knows that a gap between the picture and the vines is expected, not a sign they are lost.
Three details decide whether the handoff holds:
- Identity survives the trip. Season, block, zone and route names are identical on both screens. No “Route 7” on the phone for what the desk calls Route B.
- The purpose travels too. One line from the grower (“check vine counts in Zone 4, history looks off”) turns a walk into a task.
- The phone is built for the rows. Big targets, a route that reads like navigation, the next point always visible. That side of the job is mobile app design, with its own rules.
When the phone carries the same object, the worker doesn’t rebuild the task on a small screen in the sun. When it doesn’t, every walk starts with a call to the office: paid time spent establishing what the product should have said.
Maps and field tools
Desk map and field map telling different stories?
We design map-based products where blocks, polygons and routes stay the same object from planning to the phone.
In the rows: when the phone and the plan disagree
Our worker walks Route B and stops at the third sample point. The plan says Zone 4. The phone places them in Zone 3.
The product’s job is to show the disagreement, not pick a side silently. Phone positioning is an estimate too: both major mobile platforms report location with an accuracy radius rather than a guaranteed dot, and that radius changes with signal, terrain and the device. The worker might really be in the wrong place. The location might be fuzzy. The polygon might be off.
Musicians have a name for this kind of mistake: the right note in the wrong bar. A player who finds herself a bar behind doesn’t rewrite the song. She finds bar 32 and comes back in. The phone should help the worker do the same.
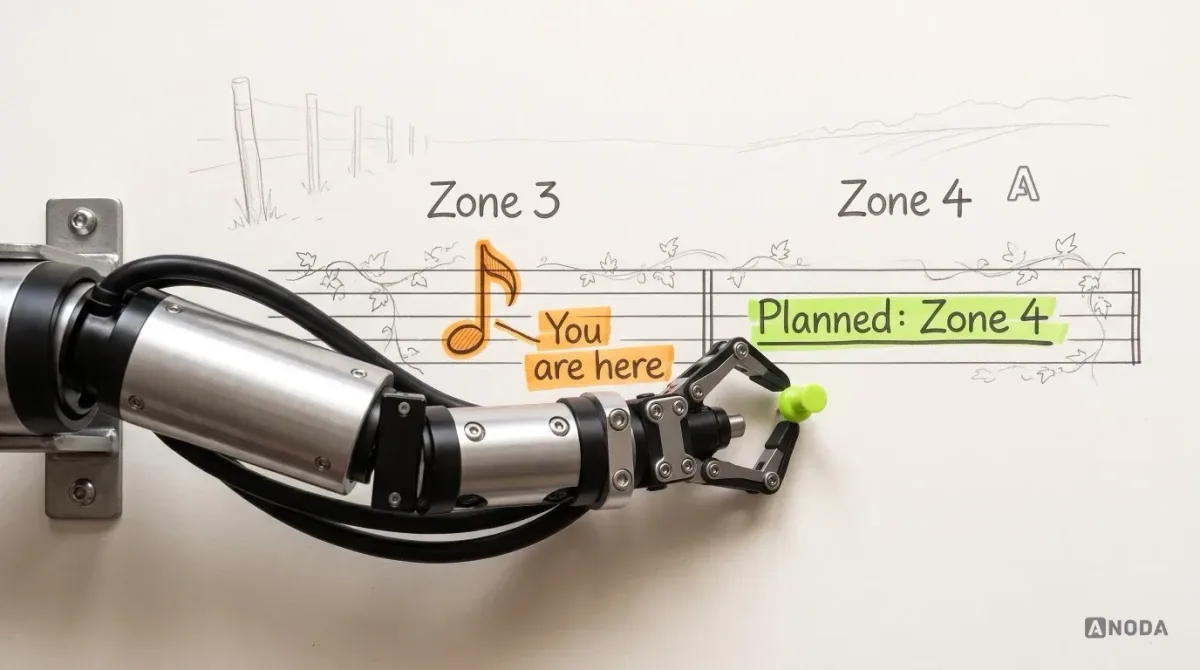
A bounded correction looks like this (illustrative behaviour):
- Show the current position, with its accuracy, against the selected zone’s polygon, so the worker sees the gap rather than an error code.
- Offer two clear actions: walk toward the planned zone with directions, or record an observation with the location mismatch visible. Keep the reported position and accuracy; label it as outside the planned zone only when that is confirmed by the worker or an agreed validation method.
- If the worker believes the polygon itself is wrong, let them flag it with a note. Do not let them redraw it from the field in the middle of the walk.
The phone must never quietly file the observation under Zone 4 because the plan expected it, or under Zone 3 so it flows into Zone 3’s numbers. Both turn a visible problem into an invisible one, and invisible field-data problems can surface at harvest, the worst possible moment to face the music.
No signal: four states an observation can be in
In our example, coverage in the rows is patchy, as it often is far from a mast. The worker records the observation with no connection, and from that moment it can be in several places. Four illustrative states:
| State | What the worker sees | What it means for the grower |
|---|---|---|
| Draft on this phone | “Draft. Not submitted.” | Recorded but not finished: the worker can still edit or discard it. The grower can’t see it. |
| Submitted, waiting to send | “Submitted. Waiting for signal.” | The worker is done and it is locked, but it is still in one pocket until the phone finds signal. |
| Synchronized | “Sent. Available to the grower.” with the time | The grower can review it. Nothing has changed in the estimate yet. |
| Conflict | “Another observation exists for this point.” Both shown | Two people recorded the same point differently. Both records remain; the grower reviews them within their input permissions, with historical changes routed to the agronomist. |
Think of a recording. A take you’re still editing is a demo. Submitted, it’s on its way. Synchronized, the label can hear it. None of those means it’s on the album. The fourth state is two takes of the same song with different lyrics. Merging them automatically is how you end up with a verse nobody wrote.
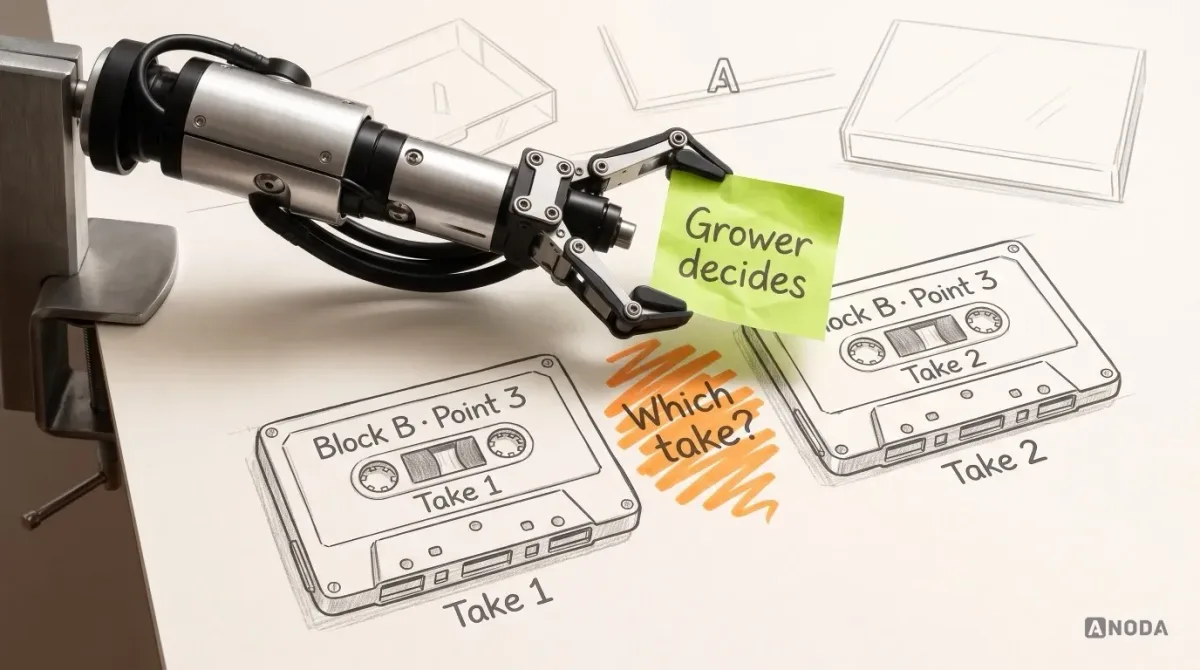
In our example the worker submits the draft, sees it waiting, then synchronized when the signal returns at the end of the row. The worker leaves knowing what made it out, instead of hoping.
One honest boundary. Design can define these states, their wording and what each one allows. Whether the product can actually store observations on the device, queue them and detect conflicts is an engineering capability, decided with the team that builds it. Our article on designing an internal tool around one repeatable workflow walks through that line between interface states and backend promises in detail, so we won’t repeat it here.
Back at the desk: review before the model sees it
The observation is synchronized. Many products skip what comes next. The tempting design is automatic: field data arrives, the estimate recalculates. It feels efficient. It is a sous-chef changing the house recipe because one plate tasted a bit flat, without telling the head chef. Maybe he’s right. Maybe that plate was the exception. Either way, the recipe is no longer the one anybody agreed on.
In our example the grower opens Block B and sees the observation as a proposed change, not an accomplished one. The screen shows:
- Source and time. Who recorded it, when, on which route, and the reported position and accuracy, and whether its zone is verified, confirmed outside the plan or still uncertain.
- Context. The imagery date (28 September) next to the observation date, so the gap between the picture and the field is explicit. If the imagery is older than the question, the screen says that the field result is newer evidence, rather than leaving the grower to do date arithmetic.
- The change it would make. Which input it would replace or adjust, before and after, and which totals would move.
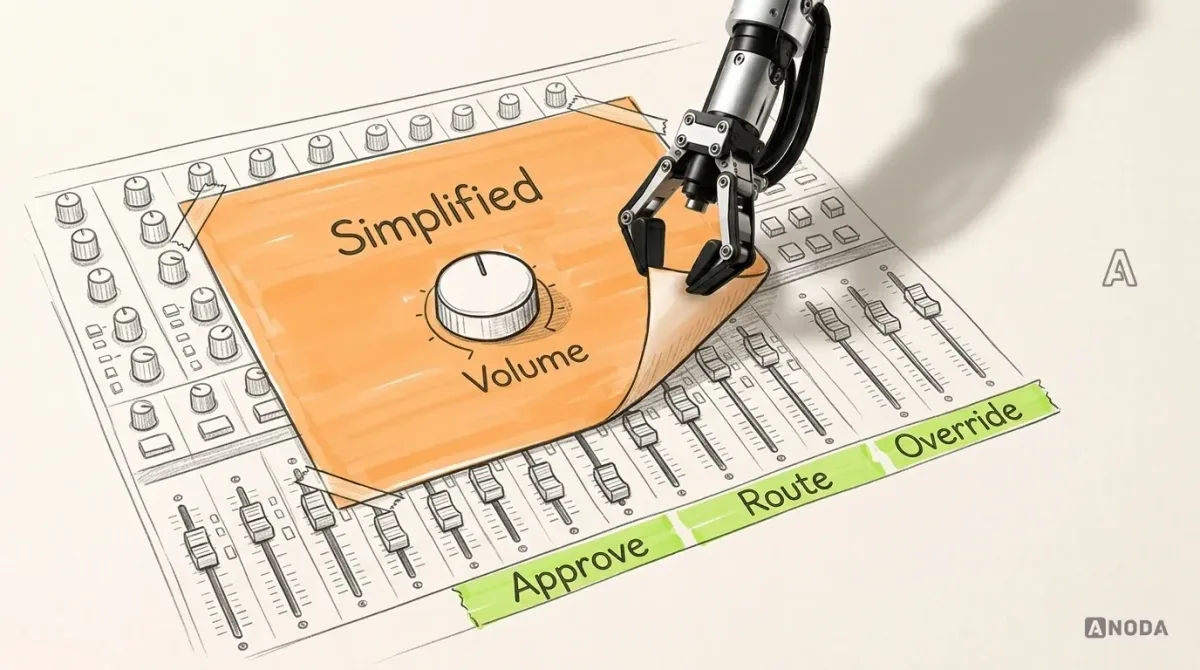
- A required decision. Accept a change to an input the grower may edit, keep it as a note, or send someone back. A proposed historical-value change requires the agronomist’s sign-off. Only after the required authorised acceptance does the client model recalculate (illustrative rule).
That review exposes the proposed input before it affects planning. Skipping it can leave the operation planning around a number nobody chose.
What we designed for VineView, and what we didn’t
This article’s walkthrough is illustrative, but the desk-to-field problem is one we have worked on. For VineView, an existing precision-viticulture platform, ANODA researched the vineyard domain and designed the yield-estimation flow from block selection through productive vines, yield and historical data, and adjustments. We also designed path-building, polygon tools and phone navigation into the existing product, so office planning could carry into field work. Specifications and states were handed to VineView’s own developers.
The boundary matters as much as the work. We designed the experience. We did not build the product, the imagery pipeline, the yield formulas or the routing algorithm, and we make no claim about forecast accuracy or harvest results. The VineView case study shows the delivered flows. The season, block and route example above is ours, invented for this article.
The lesson: a grower who has estimated harvests for years doesn’t need a product to explain the vineyard. They need it to stop losing the thread between the screen they plan on and the phone their team carries.
Test the whole trip with a grower and a worker
Many teams test desk screens with growers and phone screens with field staff, separately. That’s rehearsing every instrument in a different room and never playing the song together. Each part sounds fine; the song falls apart at the first handover.
Test one journey end to end, with a grower and a worker in the same session or back to back, on a prototype that carries real block geometry. Give them the illustrative task above and check:
- Preserved context. Can the worker name the season, block, zone and imagery date from the phone alone, without asking?
- Stale imagery explained. When the vines don’t match the picture, does the worker understand why, and does the grower see the imagery date next to the observation?
- Location mismatch handled. When the phone disagrees with the plan, does the worker know both options, and does the observation keep its location mismatch, reported accuracy and any confirmed outside-zone mark all the way back?
- Status understood. After recording offline, can the worker say whether the grower can see the observation yet?
- Review enforced. Does the grower see the proposed change, its source and its effect before anything recalculates?
- Next action clear. At every step, can each person say what they do next without a phone call?
Every “no” is a phone call, a wasted walk or a wrong number in a plan. Find them in a prototype session, or pay for them in the field in September.
Where to start
Pick one block, one estimate and one field check, and draw that trip on a single page before anyone opens a design tool. If the page is hard to write, the product is already losing the thread.
Agritech product design
Make the desk and the field work on the same vines
Show us how a decision travels in your product today, from the estimate to the phone and back. We’ll map where context gets lost and design the flow that keeps it.
Written by