In short
A UX research strategy is not a list of favourite methods. It starts with the decision your team can't make, names the evidence that would settle it, and collects the smallest credible mix of behavioural, qualitative and market evidence. Interviews and analytics answer different questions, competitor analysis is about positioning and failures rather than colours, and findings only count when they become ranked actions.
In this article
- What a UX research strategy is — and what it isn’t
- Why a strategy, not just studies
- Start with the decision, not the method
- What research can and can’t tell you
- Choosing methods by the decision
- The smallest credible mix of evidence
- Competitor analysis that actually informs strategy
- Interviews and analytics answer different questions
- Talk to the right people
- Plan the study in one page
- Separate patterns from persuasive anecdotes
- Turn findings into ranked actions
- Who does the research
- Research in B2B and specialist products
- Sharing findings so they get used
- A research strategy across the product’s life
- Research on a small budget
- Measuring whether research works
- When research becomes a ceremony
- An illustrative example
- Mistakes we keep seeing
- How ANODA helps
- Decide what you need to know
A UX research strategy is a plan for which product decisions need evidence, what evidence would settle them, and how the team will collect and use it. It starts with the decision the team cannot make — not with a method — and combines behavioural data, qualitative research and market evidence in the smallest mix that makes the decision credible. Good strategic UX research changes priorities. If it doesn’t change anything, it was a ceremony.
Most teams don’t lack research. They have interview recordings nobody watched twice, a survey from last year, three analytics dashboards and a competitor spreadsheet full of screenshots. What they lack is a reason for any of it. The research happened because research is supposed to happen, and the roadmap was decided in a meeting anyway.
That is the problem a research strategy solves. Not “how do we do more research”, but “which decisions deserve evidence, and what is the least we need to know to make them well”.
We have been designing products for 15 years, and we have seen research save products and research sink them. It saves them when it answers a question the team was about to get wrong. It sinks them when it becomes a place to hide from a decision — another round of interviews, another survey, another month — while the market moves on.
What a UX research strategy is — and what it isn’t
The terms get mixed, so let’s separate them.
- A UX research strategy decides which questions matter for the product, in what order, with what kinds of evidence, and how findings feed decisions. It spans months and connects research to the roadmap.
- A research plan describes one study: the question, the method, the participants, the schedule and the output.
- UX strategy is broader: where the product’s experience should go and why. Research informs it; it doesn’t replace it.
- Tactical research answers questions about a specific design: does this flow work, can people find this setting.
- Strategic research answers questions about direction: which problem to solve, for whom, and what would make them switch.
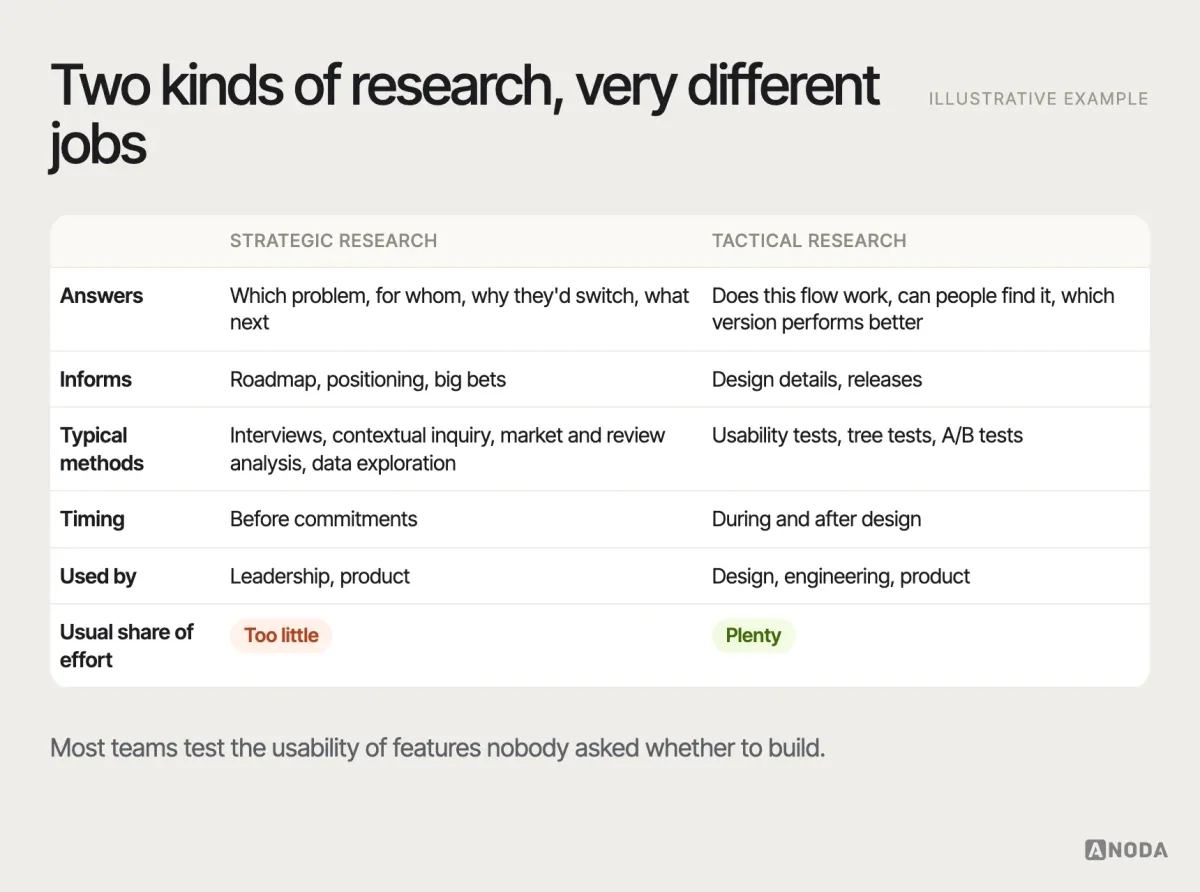
Both are needed. The typical imbalance is that teams test the usability of features nobody asked whether to build. A button that everyone can find is not a success if the feature behind it solves nothing. Strategic research is harder to schedule because it doesn’t attach to a sprint, which is exactly why it needs a strategy: left to the calendar, tactical questions always win because they’re always due tomorrow.
Why a strategy, not just studies
Without a strategy, research follows whoever asks loudest. Marketing wants a persona refresh, a product manager wants to test a flow, the CEO wants to know why a big customer left, and the researcher — if there is one — runs whichever study came in first. Each study might be fine. Together they don’t add up to anything, because nobody chose which questions mattered most.
The costs are quiet but real. The same questions get researched twice because nobody remembers the first answer. Big bets get no research because the calendar was full of small ones. Findings contradict each other because they were collected from different people for different reasons. And the team slowly concludes that research is a nice-to-have, because they can’t point to a decision it changed.
A strategy fixes this by making three choices explicit: which decisions in the coming months deserve evidence, what kinds of evidence the team will rely on, and how findings will flow into the roadmap. It is usually a page or two, reviewed each quarter. It is not a methodology manual.
What goes into the strategy document
A research strategy document can be short. A structure that works:
- Product goals for the period — what the business is trying to achieve, in plain words.
- Open decisions — the handful of decisions that are expensive to get wrong, each with an owner and a date.
- Evidence gaps — for each decision, what the team knows, what it assumes and what it doesn’t know.
- Planned studies — the studies that close the biggest gaps, in order, with a rough size.
- Always-on sources — the continuous inputs: analytics, support, reviews, regular customer conversations.
- How findings flow — where they’re shared, who reviews them, and how they reach the roadmap.
- What the team won’t research — the questions deliberately left to shipping and measuring.
The last item is the most underrated. Saying what you won’t study protects the team’s time as much as saying what you will.
Start inside the company
Before talking to a single user, talk to the people who’ll use the research: leadership, product, sales, support, engineering. Short stakeholder interviews reveal the decisions they’re facing, the assumptions they hold with the most confidence, what they already believe the data says, and where they disagree with each other. Those disagreements are gold — they’re usually the decisions most in need of evidence. They also tell you what kind of evidence each stakeholder trusts, which shapes how findings will need to be presented to change their minds.
Start with the decision, not the method
The most common way research goes wrong is starting with a method. “Let’s do some interviews.” “Let’s run a survey.” Interviews about what? A survey to decide what?
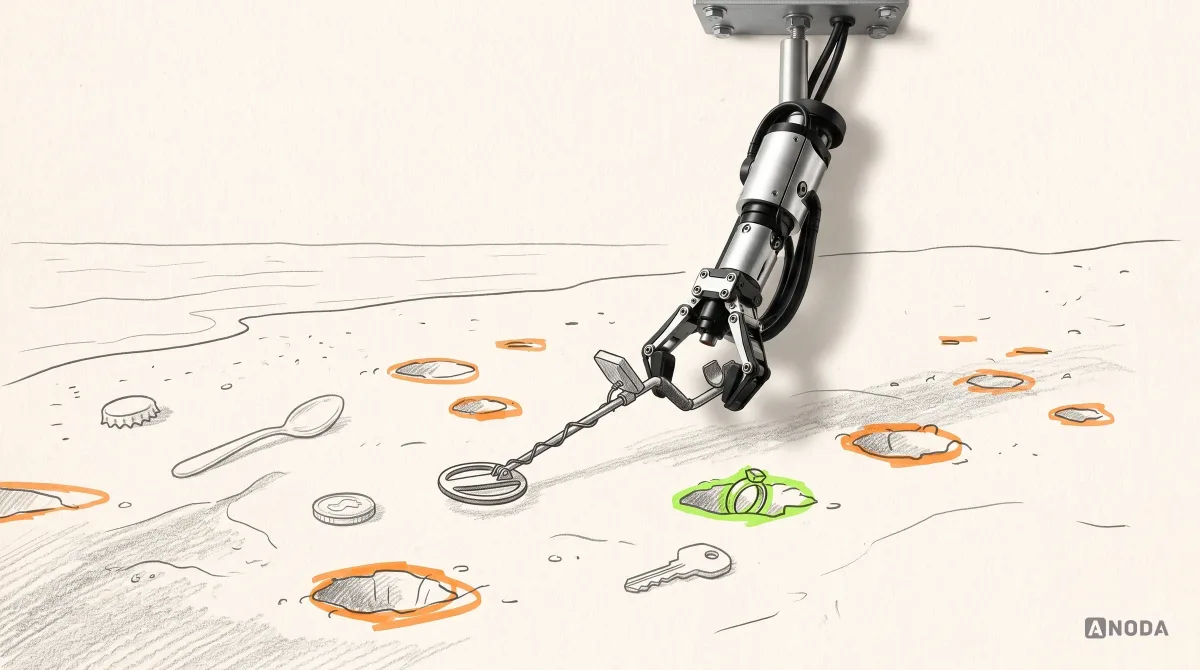
Research without a decision is sweeping a metal detector over the whole beach without knowing what you lost. You’ll find something — you always do — and then spend weeks explaining why the bottle cap is important.
Start instead with the decision the team can’t make, and work backwards:
- Decision: what are we trying to decide? “Should we build a team plan or improve the individual plan first?”
- Question: what do we need to know to decide? “Do teams already share accounts, and what breaks when they do?”
- Evidence: what would convince us either way? “Evidence that shared use is common among paying users, and that the pain is strong enough to pay for.”
- Method: what’s the cheapest way to get that evidence? “Account analytics for shared logins, support tickets mentioning colleagues, and a handful of interviews with accounts that show shared use.”
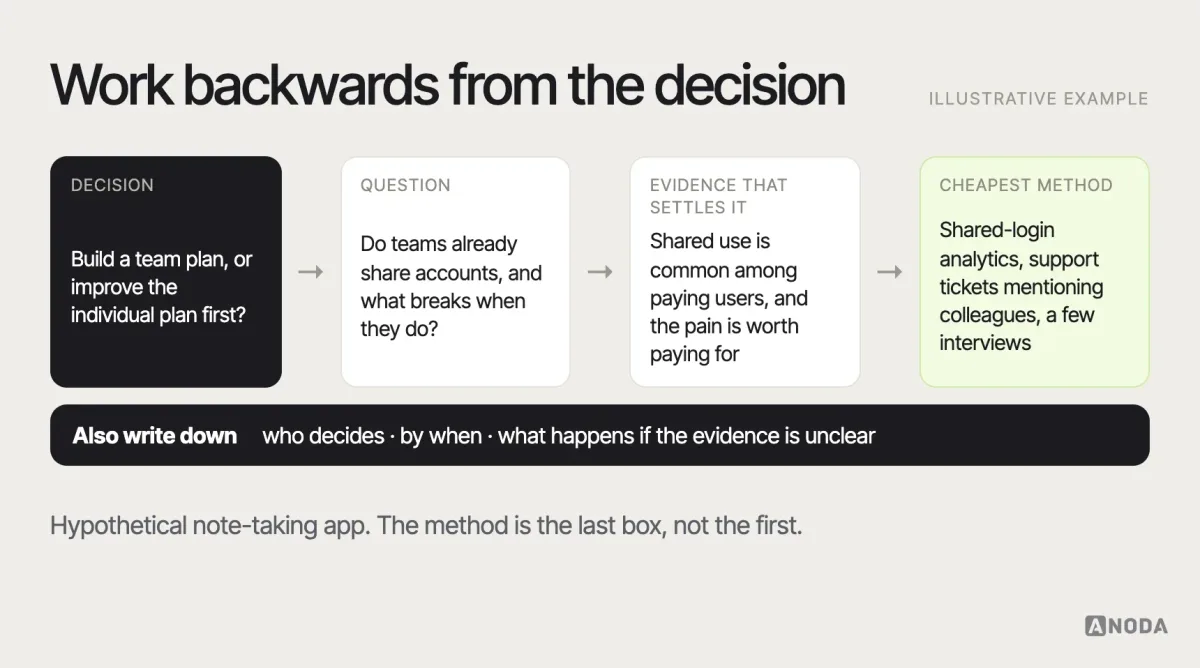
Write the decision down, including who makes it and by when. If nobody can name the decision, the research isn’t ready to start. If the decision will be made regardless of what the research finds, don’t do the research — or at least don’t pretend it’s for the decision.
Typical decisions that deserve evidence:
- which customer segment to focus on next;
- whether a problem is painful and frequent enough to build for;
- which of two or three product directions to invest in;
- why users drop off at a specific step, and what would fix it;
- whether to enter a new market or platform;
- what to cut when the roadmap is too long.
Decisions that usually don’t deserve a study: small, reversible changes you can ship and measure; questions the existing data already answers; and choices that have to be made by a date before any research could finish.
What research can and can’t tell you
Different methods answer different kinds of question. A useful way to see it is along two lines: what people say versus what they do, and why versus how many.
- Say and why: interviews, open survey answers, support conversations. Rich reasons, motivations, language — but people are poor at predicting their own future behaviour and polite about your idea.
- Do and why: observation, contextual inquiry, usability testing. You see where people struggle and can ask why in the moment.
- Say and how many: surveys. Useful for sizing attitudes and preferences across many people, weak on explaining them, and easy to bias with question wording.
- Do and how many: analytics, experiments, logs. What actually happens at scale — without any reason why.
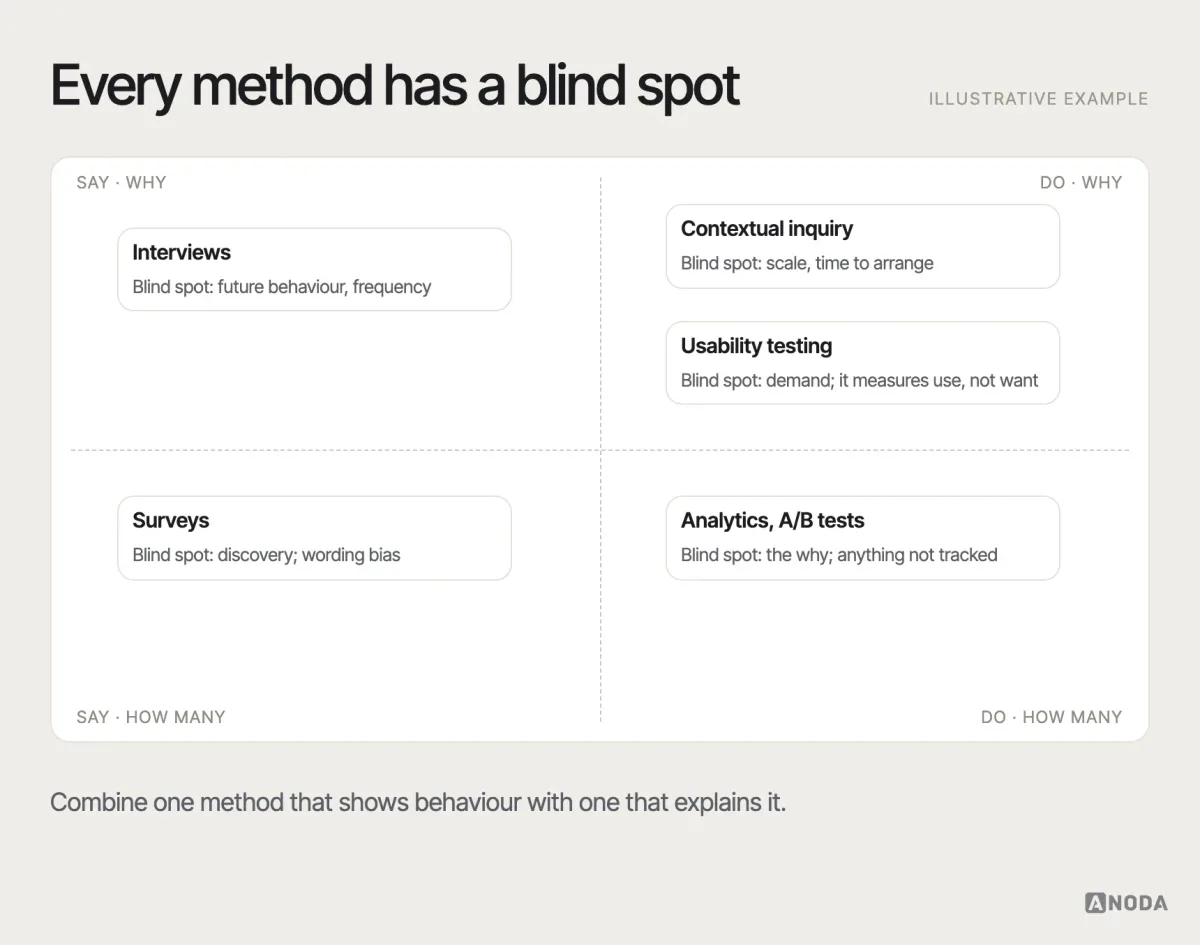
No single method covers all four. That is why strong research strategies combine at least one method that shows behaviour with one that explains it.
Choosing methods by the decision
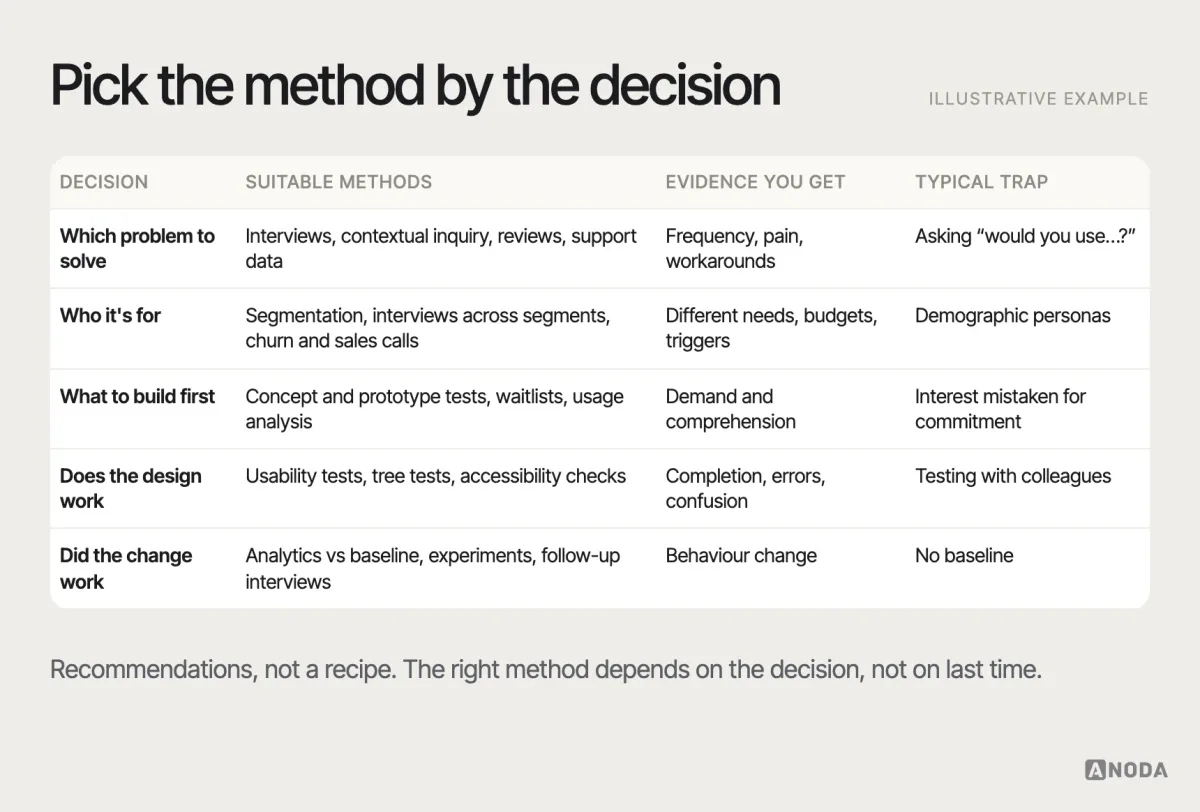
Different stages of product work bring different decisions, and each kind of decision has methods that suit it. As recommendations, not a fixed recipe:
Deciding which problem to solve. Interviews with target users about how they handle the problem today, contextual inquiry where they work, reviews and support data, market and competitor analysis. You’re looking for frequency, pain and workarounds.
Deciding who the product is for. Segmentation from existing data, interviews across candidate segments, sales and churn conversations. You’re looking for differences in needs, budgets and switching triggers.
Deciding what to build first. Concept tests, prototype tests with target users, fake-door or waitlist tests where appropriate, analysis of what current users already do. You’re looking for demand and understanding.
Deciding whether a design works. Usability testing with realistic tasks, tree testing and card sorting for structure, accessibility checks. You’re looking for completion, errors and confusion.
Deciding whether a change worked. Analytics against a baseline, experiments where traffic allows, follow-up interviews for the why. You’re looking for changes in behaviour, not opinions.
The methods, briefly
A short guide to what the common methods are good for — and what they’re not:
- User interviews: one-to-one conversations about how people deal with a problem today. Good for motivations, context and language. Not for predicting behaviour or measuring frequency.
- Contextual inquiry: observing people in their own environment while they work. Good for workarounds and the details people forget to mention. Takes more time to arrange.
- Diary studies: participants record experiences over days or weeks. Good for behaviour that unfolds over time, such as habits, onboarding or intermittent tasks.
- Surveys: structured questions to many people. Good for sizing attitudes and preferences you already understand. Poor at discovering things you didn’t think to ask.
- Product analytics: behavioural data from the product. Good for what happens and where. Silent on why, and only as good as the tracking.
- Usability testing: people attempt realistic tasks with a prototype or product. Good for finding where a design fails. Not a measure of demand.
- Card sorting and tree testing: how people group and find information. Good for navigation and structure decisions.
- Concept and prototype tests: reactions to and attempts with early ideas. Good for comprehension and early demand signals, with the caveat that interest isn’t commitment.
- A/B tests and experiments: comparing versions with real traffic. Good for measuring the effect of a change. Needs enough traffic and a clear metric.
- Support, sales and review analysis: what customers already tell you unprompted. Cheap, fast and often underused.
The smallest credible mix of evidence
Strategic decisions rarely rest on one kind of evidence. The strongest ones combine three:
- Behavioural evidence: what people actually do — product analytics, logs, conversion and retention data, support ticket volumes, sales pipeline data.
- Qualitative evidence: why they do it — interviews, observation, usability sessions, open-ended feedback.
- Market evidence: what’s happening around the product — competitors, alternatives, reviews, pricing, trends in the buyer’s industry.
When all three point the same way, you can move with confidence. When they disagree, that’s the most interesting finding of all: people say one thing, do another, and the market suggests a third. Somebody is missing context, and working out who is usually where the insight lives.
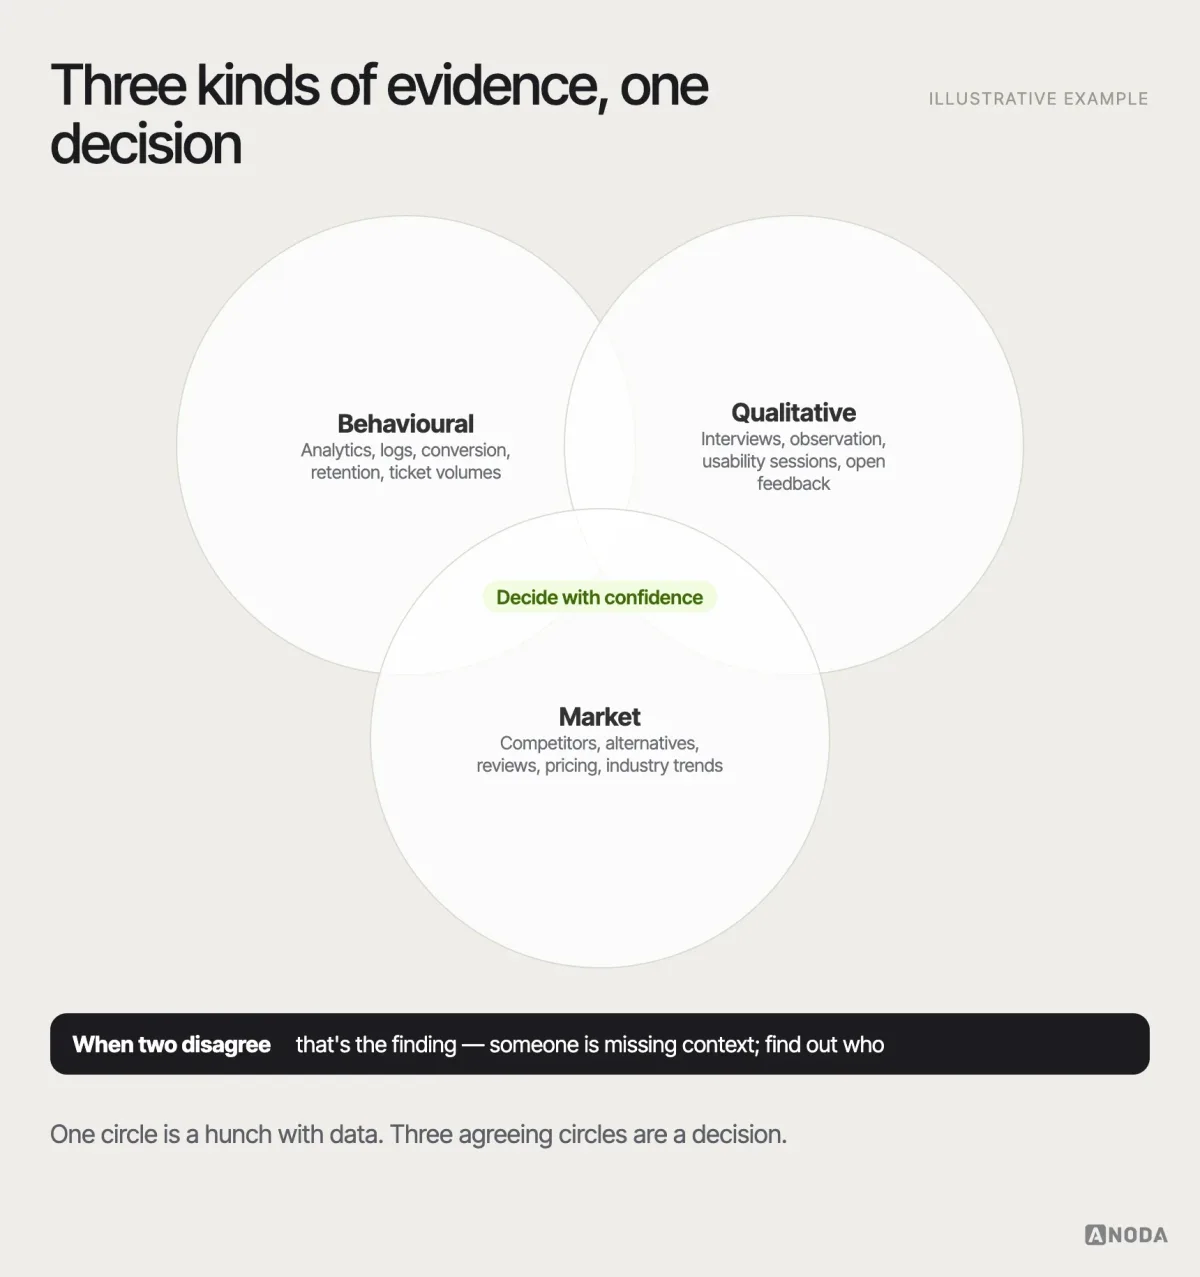
“Smallest credible” matters as much as “mix”. Every study costs time, and time is what the team is short of. For each decision, ask what the least evidence is that would make the decision defensible. For a reversible, low-cost decision, a quick look at analytics and five conversations may be plenty. For a pivot or a major build, you want more — and you want it from more than one direction.
Competitor analysis that actually informs strategy
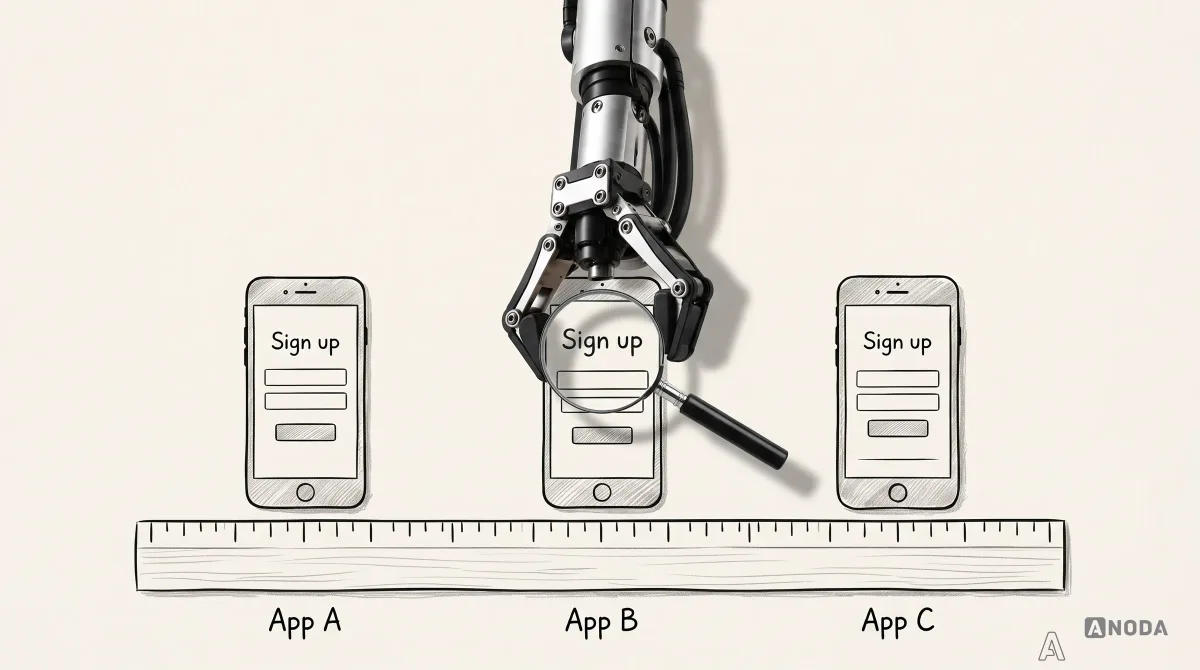
Competitor analysis is where research most often turns into decoration. A spreadsheet of competitors’ colours, fonts and sign-up forms tells you what they look like, not why they win or lose. Judging a competitor by its interface is like judging a restaurant by its napkins.
A strategic competitor analysis looks at five things:
- Positioning: who each competitor says they’re for, what they promise, and what they refuse to do.
- Acquisition: how they find customers — search, partnerships, sales teams, communities, app stores — and what that says about their costs and strengths.
- Flows: how their product handles the critical tasks end to end, including the parts after sign-up that screenshots never show.
- Reviews: what their customers praise and complain about, in their own words, across app stores, review sites and communities.
- Failure patterns: where their customers get stuck, what makes them leave, and which promises the product doesn’t keep.
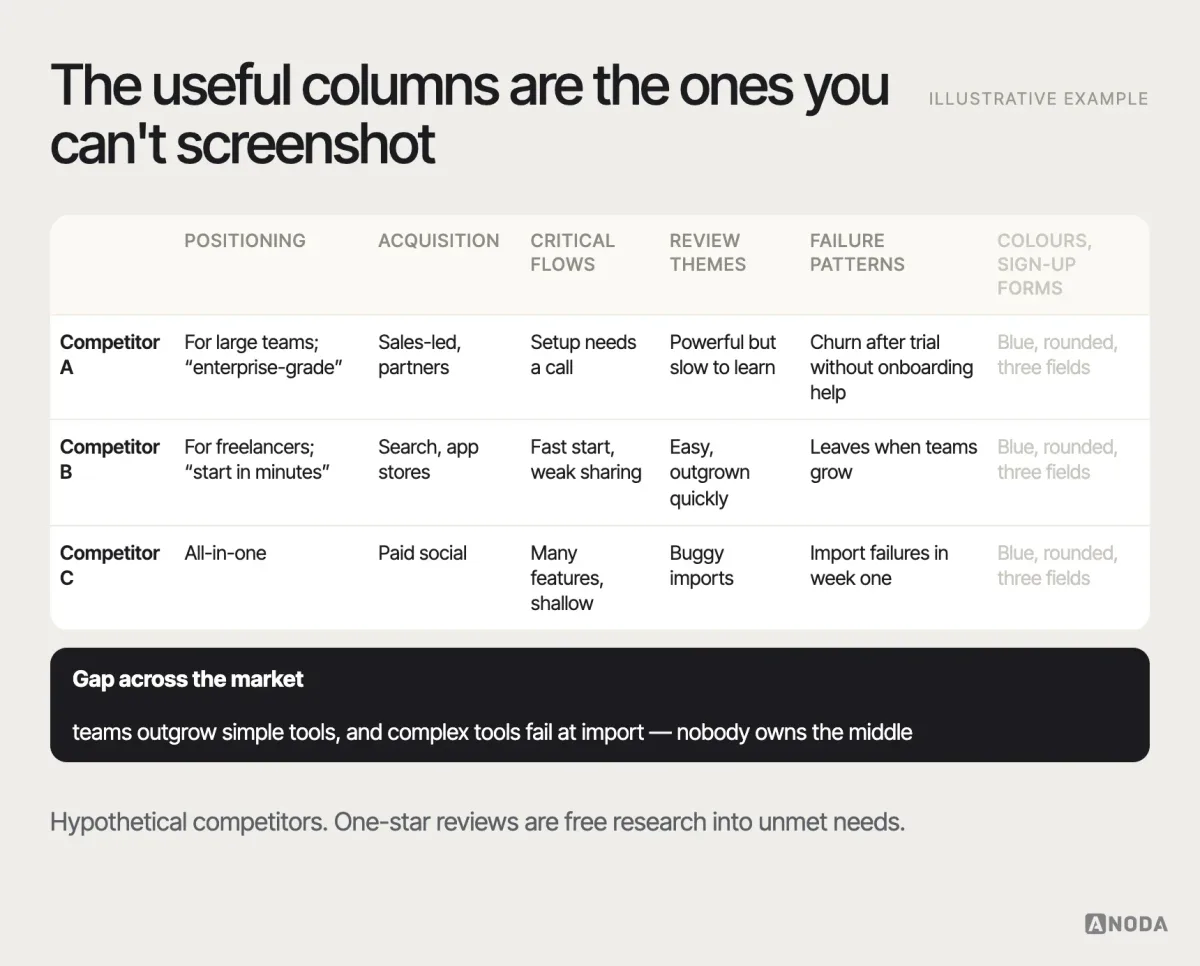
Reviews and failure patterns are usually the richest source. A competitor’s one-star reviews are free research into unmet needs; the same complaint repeated across several products points at a gap in the whole market. Our guide to UX competitive analysis goes deeper into the method.
Sign up for competitors’ products and use them for real where you legally and ethically can: go through onboarding, try the critical tasks, contact support, cancel. Note where they make you wait, what they ask for and when, and what happens after the first session. That is the part of the experience their customers live in, and the part most analyses skip.
Interviews and analytics answer different questions
A classic argument in product teams: “The interviews say users want X.” “But the analytics say nobody uses X.” Both can be true. They answer different questions and need to be read in context.
Imagine a restaurant that asks diners what they thought. The comment cards say they loved the salad. The kitchen bin is full of uneaten salad. Diners weren’t lying; they were being polite, or they liked the idea of the salad, or they loved it and still ordered the burger. You need both the cards and the bin to understand what’s going on.
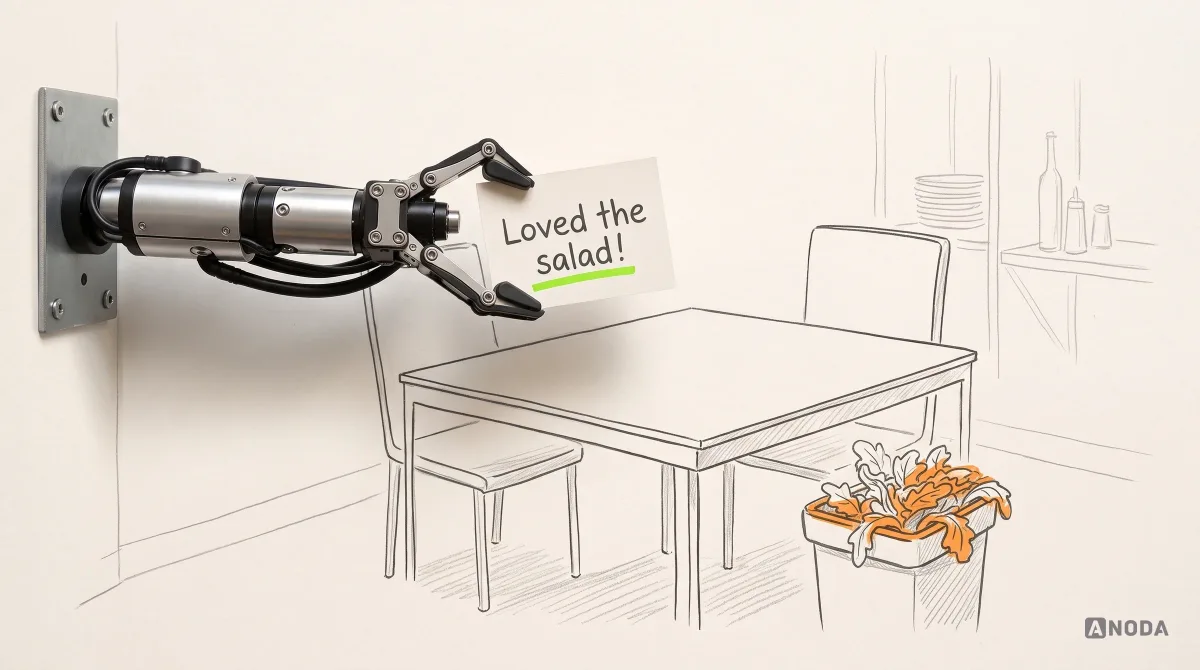
Interviews are good at reasons, context, language and workarounds. They’re poor at predicting what people will do, measuring how often something happens and representing a whole user base. Common traps: leading questions, asking about hypothetical futures (“would you use…?”), talking only to happy customers, and treating one articulate participant as the voice of everyone.
Analytics are good at what happens, how often and where people drop off. They’re poor at why, at anything you didn’t instrument, and at people who never arrived. Common traps: vanity metrics, missing or inconsistent event tracking, confusing correlation with cause, and survivorship — studying only the users who stayed.
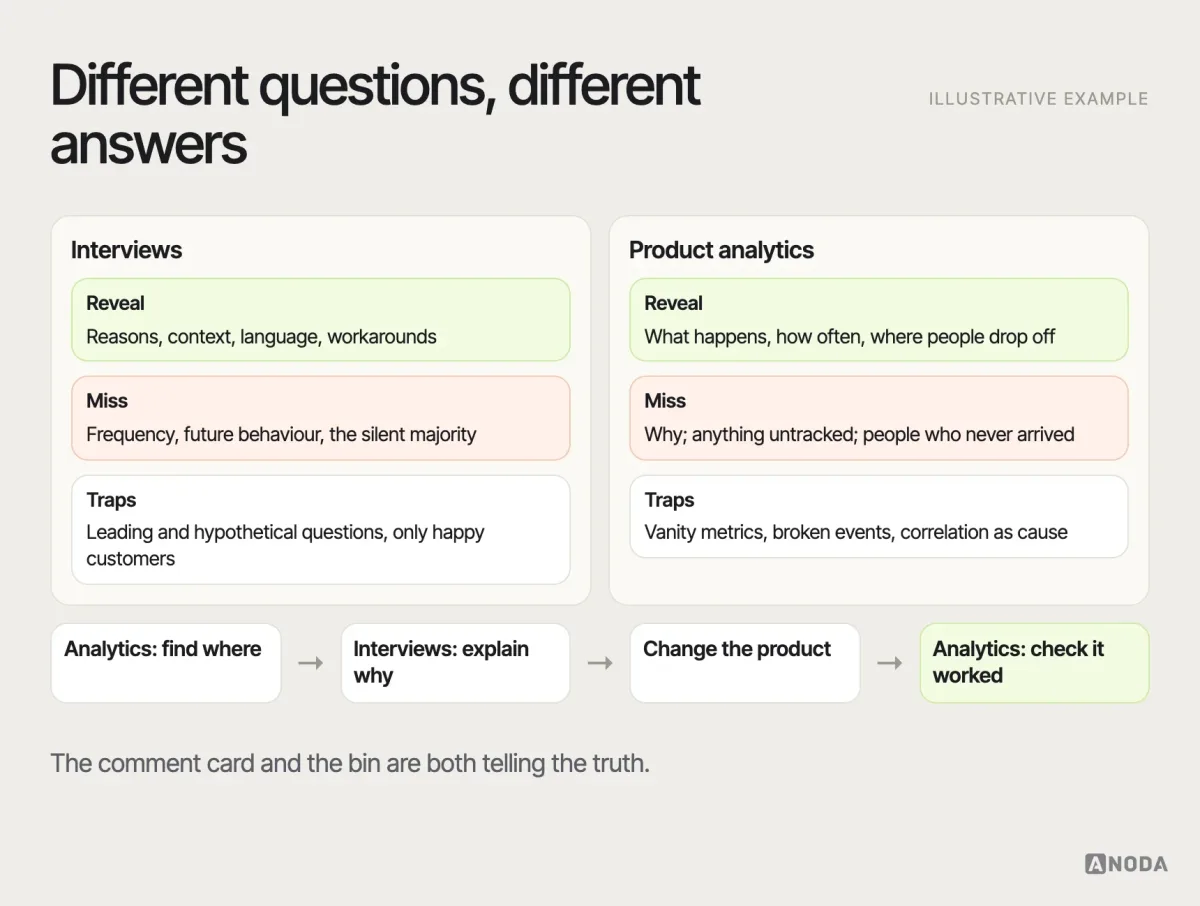
The practical rule: let analytics tell you where to look and interviews tell you what you’re looking at. Then go back to the numbers to see whether the change you made actually moved behaviour.
Asking questions that produce evidence
The quality of interviews depends on the questions. The most useful ones ask about specific past behaviour, not opinions or predictions:
- Instead of “Would you use a feature that…?”, ask “Tell me about the last time you had to…”.
- Instead of “Do you like this?”, ask “What would you do next here?” and watch.
- Instead of “How much would you pay?”, ask “What do you use for this now, and what does it cost you?”
- Instead of “Is this a problem for you?”, ask “When did this last happen, and what did you do about it?”
Past behaviour is evidence; hypothetical future behaviour is a guess, and people guess kindly. Listen for workarounds — spreadsheets, sticky notes, copying data between tools — because a workaround is proof that a problem is real enough for someone to spend effort on it.
Reading analytics responsibly
Numbers feel objective, which makes them easy to over-trust. A few habits keep analytics honest:
- Check the tracking first. Events renamed, missing on one platform or firing twice produce convincing nonsense.
- Compare against a baseline. A number means little without last month, last year or a comparable segment next to it.
- Segment before concluding. An average across new and experienced users, or across small and large customers, often hides two opposite stories.
- Look at cohorts over time. Retention and activation make sense only when you follow the same group of users.
- Remember who isn’t there. Analytics only see people who arrived and were tracked; the ones who never signed up are invisible.
Surveys that don’t mislead
Surveys are useful for sizing what you already understand qualitatively — how common a problem is, which of several needs matters most to which segment. They mislead when they’re used to discover things, when questions lead (“How much do you love…”), when answer options leave out the real answer, and when the people who respond are not the people you care about. Write surveys after interviews, not instead of them, and pilot them with a few people before sending them to many.
Talk to the right people
The value of qualitative research depends on who you talk to. Twenty conversations with the wrong people are worse than five with the right ones, because they produce confident conclusions about someone else’s problem.
Define participants by behaviour and context, not demographics. “Operations managers who scheduled more than fifty shifts last month and use spreadsheets alongside our tool” is a recruiting brief. “Managers aged 30–45” is not. Include people who left, people who chose a competitor and people who never tried the product — they explain what your current users can’t.
How many? It depends on the question and on how different your segments are. The often-quoted advice that five users are enough comes from Jakob Nielsen’s work on iterative usability testing, where small rounds of testing are repeated after each fix; it was never meant as a sample size for strategic research. For exploratory interviews, a reasonable approach is to keep going within each segment until new conversations stop producing new patterns — and to be honest when you stop earlier than that.
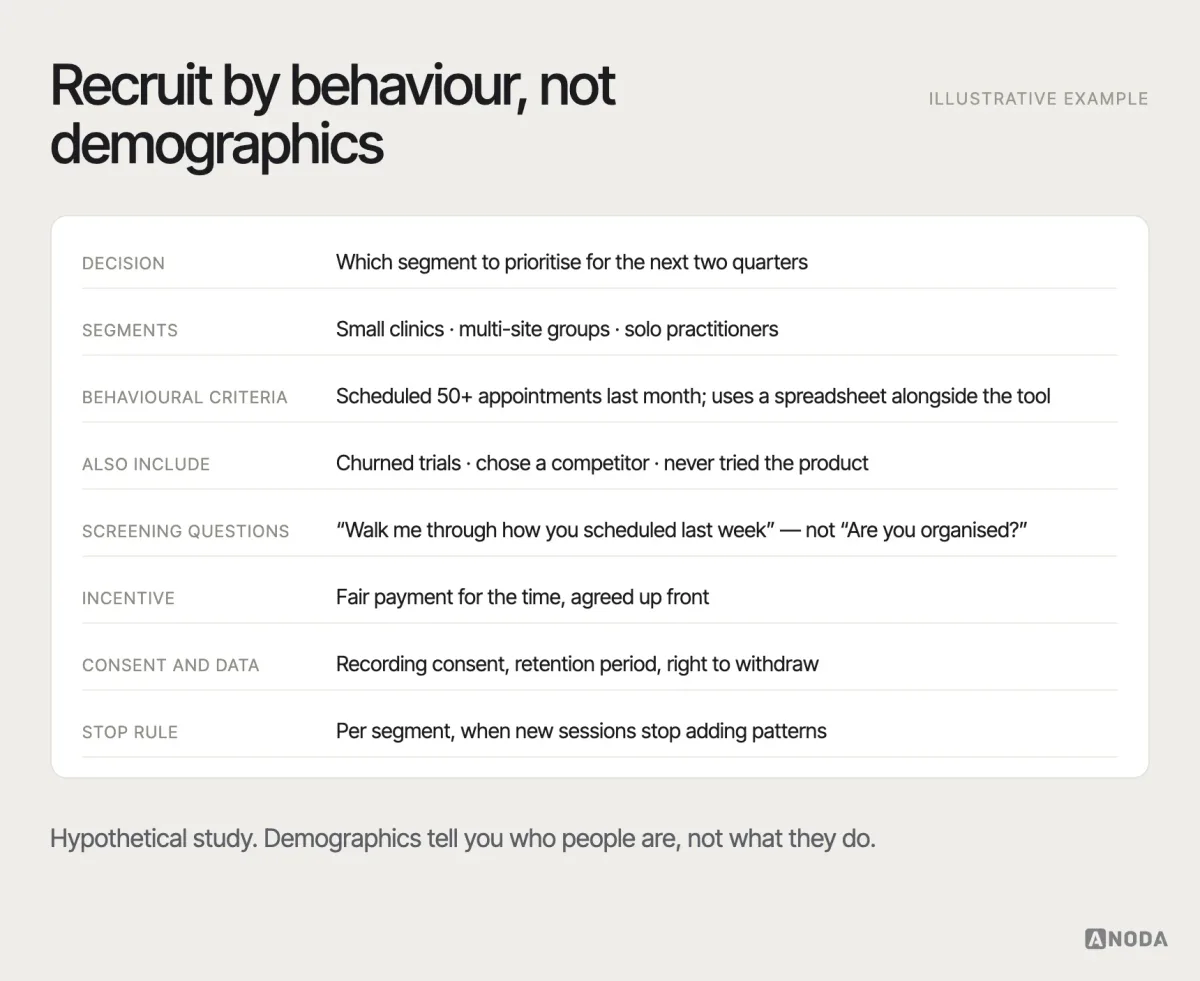
Handle participants’ data properly: informed consent for recordings, clear use and retention rules, and, where data-protection law such as the GDPR applies, a lawful basis for processing and a way for people to withdraw. Pay people fairly for their time. Research is a relationship, and it’s a short one if it’s a bad one. Keep a simple record of who took part and when, so the same enthusiastic customers aren’t interviewed every month while everyone else stays unheard. A panel of people who have agreed to be contacted makes recruiting far faster, as long as it is refreshed regularly.
Plan the study in one page
Each study inside the strategy deserves a short plan, agreed before any sessions are booked. One page is enough:
- the decision and who makes it;
- the questions the study must answer, and the ones it won’t;
- the method and why it fits;
- participants and how they’ll be recruited;
- the schedule, including when findings will be shared;
- what the output will be, and how it feeds the decision;
- what would change the plan.
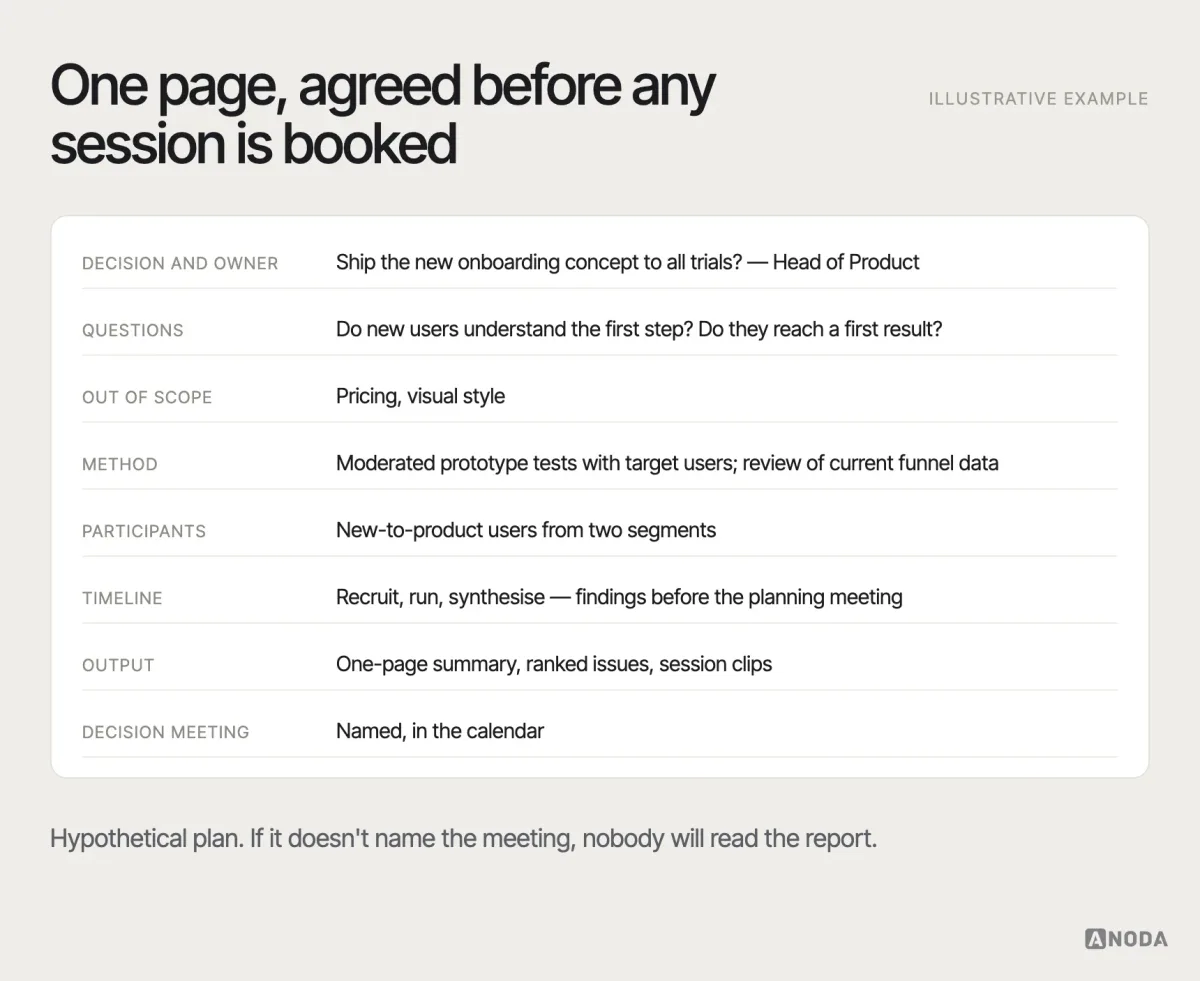
Involve the people who’ll make the decision early. Stakeholders who watched even one session argue much less with the findings. Stakeholders who first hear about the research in a sixty-slide report tend to argue with all of it.
Separate patterns from persuasive anecdotes
Every study produces a few unforgettable moments: the participant who swore at the screen, the customer quote that sums everything up, the CEO’s friend who “hates the new design”. Anecdotes are powerful, which is exactly why they’re dangerous. The loudest story in the room is not necessarily the most common one.
Synthesis is the discipline of finding patterns. Pull observations out of each session, cluster them, and count how many participants and segments each pattern appears in — and whether behavioural data supports it. Keep the vivid quotes, but use them to illustrate patterns, not to replace them.
A practical synthesis routine: write each observation on its own note, with the participant and segment; group notes into themes without deciding the themes in advance; name each theme as a finding in a full sentence (“Managers rebuild the rota in a spreadsheet because imports fail silently”), not a topic (“Imports”); then check each finding against the behavioural data before calling it a pattern. Doing this with two or three people from different roles — design, product, engineering — produces findings the whole team trusts.
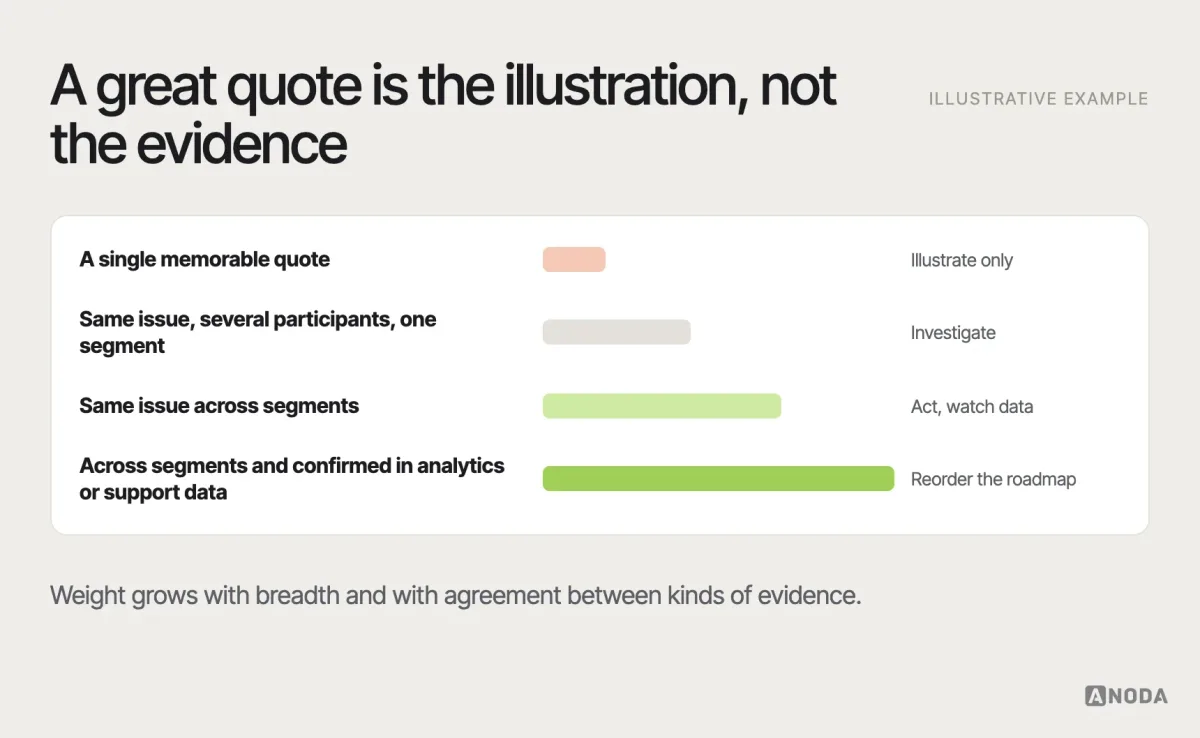
Be explicit about confidence. “We saw this in most interviews and it matches the drop-off in analytics” is a different finding from “two participants mentioned this”. Both are useful. Only one should reorder the roadmap.
Turn findings into ranked actions
Research that ends with a report ends. The work that matters is turning findings into decisions: what changes, in what order, and who owns it.
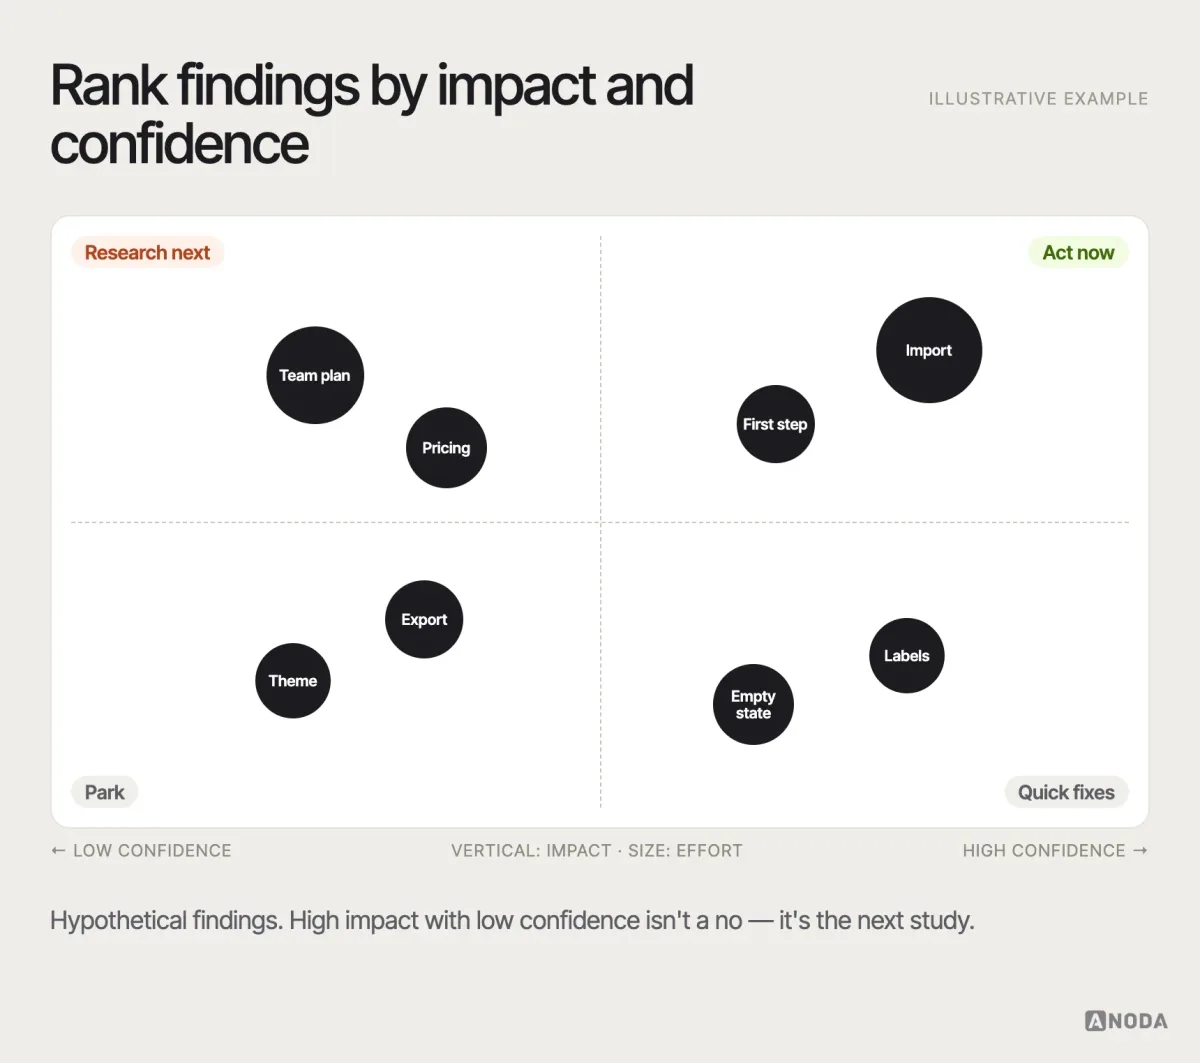
A simple way to rank what you found: for each finding, estimate the impact on the goal, the confidence in the evidence and the effort to act on it. High impact and high confidence go first. High impact and low confidence become the next research question. Low impact waits, however interesting it was.
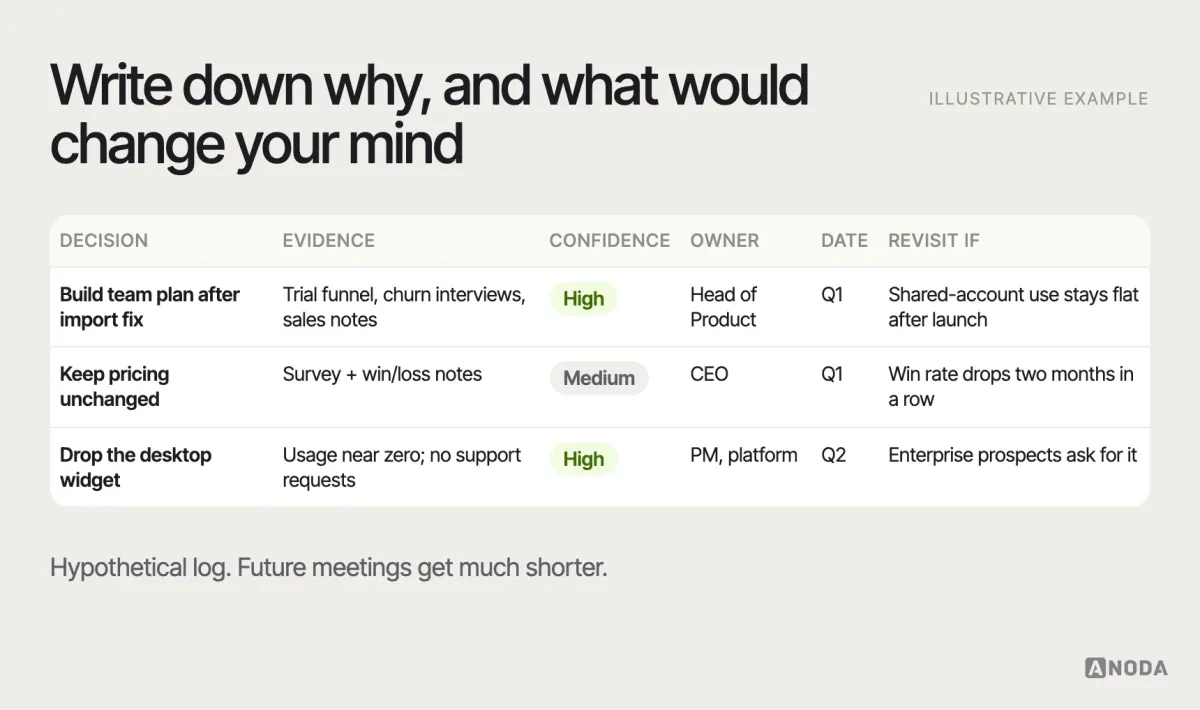
Then record the decision. A lightweight decision log — the decision, the evidence behind it, the confidence, the date and what would make you revisit it — stops the team from re-litigating the same questions every quarter and makes it obvious when new evidence should reopen one.
UX research
Stuck on a decision the team keeps postponing?
We design and run focused research around the decision you need to make, and translate the evidence into ranked product priorities — not a report that sits in a folder.
Who does the research
Research doesn’t have to be done only by researchers. In many teams, designers and product managers run interviews and usability tests, and that’s healthy — it keeps the people who decide close to the people who use the product. It does need guardrails: shared templates for plans and consent, training in unbiased questioning, a place where findings are stored, and a person who reviews the strategic studies.
Trained researchers matter most where the stakes and the complexity are highest: strategic studies before big bets, research with vulnerable or hard-to-reach participants, surveys meant to be representative and synthesis across many sources. A good split is that the team handles continuous, tactical research, and specialists — in-house or external — lead the strategic work and keep the method honest.
On Payyro, a crowdfunding platform where donors pay overdue bills for struggling families directly to landlords and utilities, four roles share one product. The UX audit produced full personas for each role — pains, motivations, core needs and devices — and every journey was mapped per role. The seams where one role hands off to another got the most attention, because that is where the product lives.
Research in B2B and specialist products
Research for B2B, enterprise and specialist products has its own constraints. Users are few and busy, access often goes through account managers, the buyer is rarely the daily user, and some environments — hospitals, factories, banks — are hard to observe. It helps to plan for this: recruit through customer success and sales with a clear ask and a short time commitment; research buyers and users separately, because they decide on different grounds; use existing channels such as onboarding calls, support escalations and quarterly reviews as research moments; and agree confidentiality up front. Small numbers are normal here, which makes triangulation with usage data and support history even more important.
For the warehouse robot command center we redesigned for Vecna, the personas were the associates who work the floor, and their context shaped the interface as much as their tasks did: cold, heat, gloves, fatigue and limited English.
Sharing findings so they get used
Findings that nobody reads don’t change anything. How research is shared matters as much as how it’s done.
- Lead with the decision. Open with what the evidence suggests the team should do, then the evidence, then the detail.
- Show, don’t just tell. Short video clips of real sessions persuade more than any chart. One two-minute clip of a user failing a task can end a months-long debate.
- State confidence. Separate what you’re sure of from what you suspect, and say what would increase confidence.
- Keep it short. A one-page summary and a short session with the decision-makers beat a long report. Put the detail in an appendix for those who want it.
- Follow up. Check a few weeks later what changed. If nothing did, find out why — that’s feedback on the research, too.
A research strategy across the product’s life
Research needs change as the product matures. Early on, most questions are strategic: which problem, for whom, what to build first. After launch, tactical questions multiply: which flows fail, which features get used. Mature products need both, plus research into new segments and markets.
A workable rhythm, as a recommendation:
- Continuously: a steady flow of conversations with users and a regular look at behavioural data, so the team is never far from reality.
- Every quarter: a review of the big open decisions and the evidence gaps behind them, feeding the roadmap.
- Before major bets: focused strategic studies, with the decision named up front.
- Around every significant release: usability testing before, behavioural checks after.
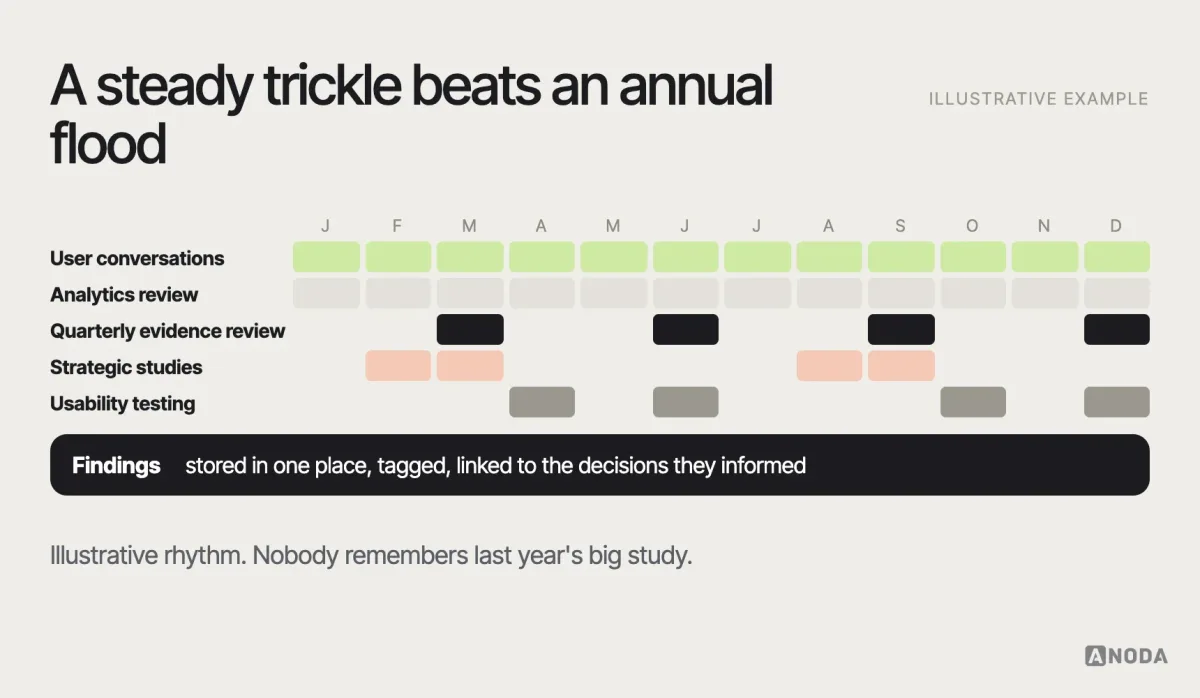
Keep what you learn findable. A shared repository of findings, tagged by topic and linked to the decisions they informed, prevents the same study being run twice and lets new team members catch up in a day instead of a quarter. It doesn’t need special software; it needs an owner.
Research on a small budget
Not every team has researchers, recruiting agencies or a research budget. A research strategy still works; it just leans on cheaper sources.
- Use what you already have. Support tickets, sales call notes, app store reviews, cancellation reasons and product analytics are free and often untouched.
- Talk to customers every week. A few short calls a week, run by the product team itself, add up to a lot of understanding over a quarter.
- Test with prototypes early. A clickable prototype and a handful of target users catch many problems before any code is written.
- Borrow the market’s research. Competitors’ reviews, public forums and communities where your users talk to each other are research you don’t have to run.
- Focus on the one big decision. With little capacity, spend it on the question that would be most expensive to get wrong.
Small teams have one advantage: the people who hear users are often the same people who decide what to build. Use it.
Measuring whether research works
If research is supposed to change priorities, you can check whether it does. Useful signals: the share of roadmap decisions that cite evidence; how often research changed or stopped a planned piece of work; how quickly findings reach the people who decide; and whether shipped changes based on research moved the behaviour they were meant to move. None of these needs precise measurement. A quarterly look at the decision log answers most of them.
When research becomes a ceremony
Research is valuable when it changes priorities. It becomes a ceremony when it doesn’t — when studies run because they always run, when findings confirm what someone already decided, or when “we need more research” is the polite way to avoid making a call.
Signs you’re in ceremony territory:
- nobody can name the decision the study is for;
- the roadmap was fixed before the research started;
- every study “validates” the current plan;
- reports are long, and nothing changes after them;
- the team keeps asking for one more round before deciding something reversible.
Research should reduce the risk of a decision, not replace the decision. At some point the evidence is good enough, the remaining uncertainty can only be resolved by shipping, and the right move is to decide, measure and adjust. Using research to fabricate certainty — or to delay a call someone doesn’t want to make — wastes the budget and the team’s trust in research itself.
An illustrative example
Here is how a research strategy plays out in an illustrative example, not a specific client. A B2B scheduling tool has flat growth. The leadership team is split: half want to build an enterprise tier with advanced permissions, half want to rebuild onboarding.
Instead of debating, the team names the decision: which investment, enterprise tier or onboarding, is more likely to grow revenue this year? Then the evidence that would settle it: how many trials fail in the first week and why; how many lost deals cite missing enterprise features; what competitors’ enterprise customers complain about.
The mix is small. Analytics show where trials stall — most never create a second schedule. Support tickets and a short series of interviews with churned trial users explain why: importing existing rotas is confusing, so people give up before seeing value. Sales call notes show enterprise features come up in a minority of lost deals, mostly from prospects who were never a good fit. Competitor reviews show enterprise customers of rival tools complaining about the same import problem.
The evidence points one way, and the decision follows: fix the import and first-week experience first, keep enterprise permissions on the roadmap with a clear trigger to revisit. The findings become ranked actions with owners, and the decision goes into the log with its evidence. Nobody needed a sixty-slide report.
Three months later, the team checks the log. Trials that complete an import now reach a second schedule far more often, and the enterprise question comes back with fresh evidence: two larger prospects asked for permissions during onboarding calls. The decision is reopened on purpose, with evidence, rather than by whoever argues loudest in the next planning meeting. That is what a research strategy looks like when it works — not a big study, but a steady habit of deciding with evidence and revisiting when it changes.
Mistakes we keep seeing
- Starting with a method. “Let’s do interviews” before anyone has named the decision.
- Asking people to predict the future. “Would you use this?” produces kind answers and bad forecasts.
- Treating analytics as the whole truth. Numbers without context lead to confident wrong conclusions.
- Competitor analysis as a mood board. Colours and sign-up forms instead of positioning, acquisition and failures.
- Recruiting whoever is available. Friends, colleagues and happy customers, instead of the people whose behaviour matters.
- Letting anecdotes set priorities. The most memorable quote wins the roadmap.
- Reports instead of decisions. Findings documented beautifully, acted on never.
- Research as a delay tactic. One more study, again, for something that could be tested by shipping.
How ANODA helps
We design and run focused research around the decisions our clients need to make: discovery interviews and contextual research, usability testing, analytics reviews, competitor and review analysis, and the synthesis that connects them. More importantly, we translate the evidence into product priorities and designs, so research ends in a decision rather than a document. We won’t fabricate certainty the evidence doesn’t support, and we won’t recommend another study when the honest answer is to decide and measure.
If your team is facing a decision it can’t settle, our UX research team can help you find the smallest credible evidence to make it. More practical guides are on the ANODA blog.

UX research
Need evidence for your next product decision?
Tell us the decision. We’ll design the research around it, run it, and turn the findings into ranked actions your team can use.
Decide what you need to know
A UX research strategy isn’t about doing more research. It’s about doing the research that changes what you build. Define the decision, collect the smallest credible mix of behavioural, qualitative and market evidence, separate patterns from persuasive anecdotes, and turn findings into ranked actions. Then decide — and measure whether you were right.
Frequently asked questions
What is a UX research strategy?
A plan for which product decisions need evidence, what evidence would settle them, and how the team will collect and use it over the coming months. It starts from open decisions rather than methods, combines behavioural, qualitative and market evidence, and defines how findings reach the roadmap.
What is the difference between strategic and tactical UX research?
Strategic research informs direction — which problem to solve, for whom, and what to build next. Tactical research evaluates specific designs — whether a flow works or people can find a feature. Most teams need both, but tactical research tends to crowd out strategic work unless it is planned.
How do you choose UX research methods?
Work backwards from the decision: name the decision, the question behind it and the evidence that would settle it, then choose the cheapest method that produces that evidence. Combine at least one method that shows behaviour, such as analytics or usability testing, with one that explains it, such as interviews or observation.
Should we trust interviews or analytics?
Both, for different questions. Analytics show what happens, how often and where; interviews explain why. A reliable pattern is to spot an issue in the data, explain it through interviews or observation, and then check in the data whether the fix changed behaviour.
How many users do you need for UX research?
It depends on the question and the number of distinct segments. The well-known advice that five users are enough comes from iterative usability testing, not strategic research. For exploratory interviews, a practical approach is to continue within each segment until new conversations stop producing new patterns.
How do you make research findings actionable?
Lead with the recommended decision, state confidence, show short clips from real sessions, and rank findings by impact, confidence and effort. Assign owners, record decisions with their evidence in a decision log, and check later whether the change worked.
Written by