In short
A good web app example isn't a pretty screenshot. It's a product that makes a real task easier, and you can see how in its navigation, data, states, permissions and feedback. Here are 15 web apps, from Linear to GOV.UK services, analysed the same way: the task, the decision, the trade-off and where the pattern would break in your product. Borrow principles, not surfaces.
In this article
- Why screenshot galleries mislead
- What counts as a web app
- How we analysed each example
- 15 web app design examples, analysed
- Tables and data-heavy screens
- How the examples teach new users
- What the 15 examples have in common
- Permissions: designing for who can do what
- Accessibility and responsive behaviour are part of the task
- What you can borrow, and what you can’t
- Mistakes teams make when copying examples
- How to study a web app example yourself
- Why ANODA designs the workflow behind the screen
- Related ANODA web app cases
- How we use examples on real projects
- The decision rule
- Documentation for these patterns
A good web app design example is not a pretty screenshot. It’s a product that makes a real task easier, and you can see how: where the most important thing sits, how you get around, what happens when something loads, fails or is empty, who is allowed to do what, and how the product tells you it worked. Below are 15 web apps worth studying, each analysed the same way: the task, the context, the decision, what you can see, the trade-off and the lesson you can borrow.
Search for web app design examples and you’ll drown in screenshots. Galleries of dashboards in dark mode, onboarding screens with friendly illustrations, settings pages that look calmer than any settings page has ever felt to use. They’re lovely. They’re also almost useless on their own.
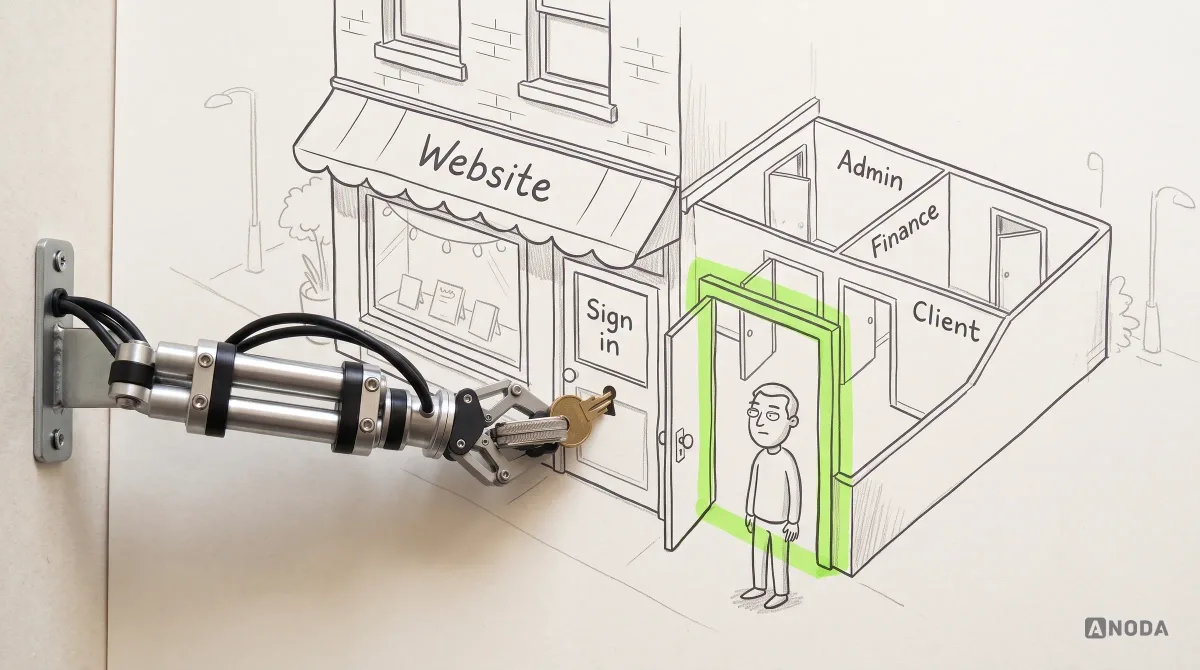
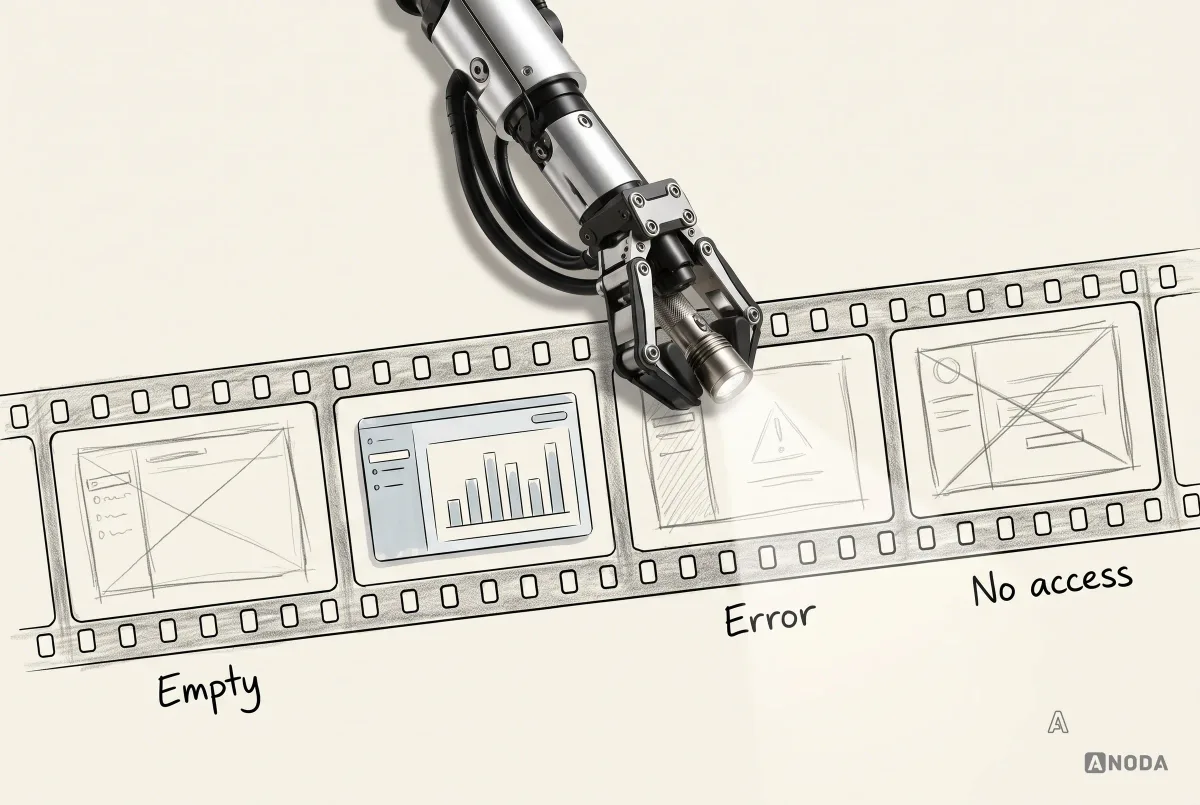
A screenshot shows one frame of a film. It doesn’t show what happened before, what happens when you click, what the screen looks like with no data or with ten thousand rows, what the error says, or who the product was designed for. Copying a screenshot is like copying the front elevation of a house without the floor plan: you get the same windows and none of the rooms.
A common mistake is borrowing the appearance of another product without its workflow. A team copies the look of a famous product built for a different user, a different task and a different scale, then wonders why its customers still get lost. The borrowed dashboard is beautiful. The support queue is full. The users you paid to acquire leave in week one, politely, without telling you why.
So this article doesn’t ask “does it look good?”. It asks “what does it help someone do, and how?”. For each of the 15 examples, you’ll see the task it serves, the decision that makes that task easier, what that decision costs and where it would break in a different product. The last part matters most. A pattern that’s brilliant in one product can be an expensive mistake in yours.
Why screenshot galleries mislead
Design galleries are useful for one thing: seeing what’s possible visually. They’re dangerous for everything else, for three reasons.
First, they show the best frame. Nobody uploads the empty state, the validation error or the permissions screen. You see the dashboard with perfect data, not the one with three rows and a failed import.
Second, they remove the context. A screenshot doesn’t tell you who uses the product, how often, on what device or what’s at stake. A dense trading screen and a calm meditation app are judged on the same wall, as if they had the same job.
Third, they reward what looks good in a thumbnail. Big type, soft gradients, generous white space. Those things photograph well. They don’t necessarily help a claims handler process 60 cases before lunch.
That doesn’t make galleries useless. It makes them a mood board, not evidence. The evidence is in the behaviour.
What counts as a web app
A website mostly tells you things. A web app lets you do things, repeatedly, with your own data. That’s the line that matters for design.
A marketing site is a shop window: people look, read, maybe click “Book a demo”, and leave. A web app is the workshop behind it: people log in, create, edit, search, approve, pay, share and come back tomorrow to continue. The design questions change completely. On a website, the question is “does the visitor understand the offer?”. In a web app, it’s “can this person finish their task, correctly, every day, without calling support?”.
Web apps have things websites rarely do:
- Persistent data that belongs to the user or their team.
- States: empty, loading, partial, error, offline, saved, unsaved.
- Roles and permissions: not everyone can see or change everything.
- Repetition: the same task done hundreds of times, where every extra click costs real time.
- Consequences: a wrong click can send an invoice, delete a record or merge broken code.
That’s why a web app can’t be judged by its hero section. It has to be judged by what happens on day 40, on row 3,000, on the third error of the afternoon.
If you want the principles and the end-to-end process behind good web apps, our guide to modern web app design covers them. This article is about learning from real products.
What makes a web app design “modern” isn’t a visual trend either. Modern web apps are expected to save automatically, work across devices, show other people’s changes, recover from a dropped connection and, increasingly, include automation or AI that suggests things on the user’s behalf. Each of those raises the same design question in a new form: does the person always know what’s happening, and can they correct it? The examples below were chosen because they answer that question clearly, not because they’re the newest or the most fashionable.
How we analysed each example
Every example below is looked at through the same six questions. It keeps us honest, and it keeps the comparison fair.
- Task. What is the user trying to get done?
- Context. Who is the user, how often do they do this, and what’s at stake if it goes wrong?
- Decision. Which design decision makes that task easier?
- Evidence. What can you actually see in the product? We describe visible, documented behaviour only.
- Trade-off. What did the decision cost, or who does it not suit?
- Lesson. What can you borrow, and what depends on context?

One rule matters more than the rest: we don’t guess results from screenshots. We can see that a product puts a command menu one keystroke away. We can’t see its retention, its conversion rate or its support volume, and we won’t pretend to. Anyone who tells you a product “increased engagement by 40% with this button” from the outside is making it up.
The interfaces are shown as simplified pattern diagrams, not screenshots. That’s deliberate. The point is the decision, not the pixels, and products change their pixels constantly. Use the product’s current documentation when adapting a pattern: features and availability can differ by plan, account and release.
15 web app design examples, analysed
The examples are grouped loosely by the kind of problem they solve: moving fast through work, shaping data, handling money and consequences, working together, getting forms and states right, and keeping a large product coherent. Each one is here for a specific decision, not because it’s famous.
Linear: a product built for people who live in it
Task: triage, plan and move through a large backlog of issues, many times a day.
Context: software teams who spend hours in the tool. For them, every extra click is repeated hundreds of times a week.
Decision: make the keyboard the fastest path to everything. Cmd/Ctrl+K opens a command menu that can act on whatever is selected. Single keys do common jobs: C creates an issue and F opens filters. Saved views can make repeated issue queries easier to return to. Incoming requests land in a Triage inbox, where accept, decline, mark as duplicate and snooze each have a key.

Trade-off: a keyboard-first product rewards people who learn it and can feel dense to occasional visitors. Linear softens this by keeping every action reachable with the mouse too, and by making shortcuts discoverable alongside the visible controls.
Lesson: if your users do the same task all day, speed is the feature. A command menu and a handful of shortcuts cost little to design and pay back on every working day. If your users visit once a month, spend that budget on clarity instead.
Where it breaks: in a product for occasional users with a tight task, like submitting an expense. A keyboard-first menu nobody discovers is a feature you paid for and nobody uses. The same shortcut that saves an engineer ten minutes a day saves your quarterly user nothing.
Notion: flexibility that stays out of the way until you need it
Task: write, organise and structure information, from a quick note to a team wiki.
Context: very different users with very different needs, from one person’s to-do list to a company handbook.
Decision: keep the page simple and put the power one keystroke away. Typing / opens a menu of blocks: headings, lists, tables, embeds. Toggles hide detail until someone opens them. A new, empty page doesn’t leave you staring at nothing; it offers ways to start, such as a template or a table. Databases can be shown as a table, board, timeline, calendar, list, gallery, chart or form, and each view keeps its own filters and sorting.

Trade-off: a blank canvas with endless options suits people who enjoy building their own system. People who just want to finish a task can find it overwhelming. Freedom is a feature right up until someone has to decide how to use it.
Lesson: progressive disclosure works: show the simple path first, and let people pull in complexity when they need it. But decide whether your users want a toolbox or a finished tool. Most business users want the tool.
Where it breaks: in regulated or high-stakes workflows. Letting every team invent its own page structure is great for a wiki and dangerous for a clinical checklist or a loan application, where the structure is the safety.
Airtable: one set of data, many ways to look at it
Task: manage structured information, such as content calendars, inventories and project trackers, without building a custom database.
Context: teams whose different people need to see the same records in different ways.
Decision: separate the data from how it’s displayed. The same records can appear as a grid, form, calendar, gallery, kanban, timeline, list or Gantt chart, and every view shows the same underlying data. Fields have real types, like dates, currency, linked records, formulas and users, so the data stays structured. Views can be collaborative, personal or locked. Their availability and who may configure them depend on plan and permissions; a personal view lets a person adjust their view without changing the shared one.

Trade-off: flexible structure means someone has to design the structure. A badly planned base is a spreadsheet that has learned to break in new ways.
Lesson: when different roles need the same data, don’t build a separate screen for each of them. Build one model and several views. And protect shared views from well-meaning edits: a locked view is a small feature that saves a lot of Monday-morning confusion.
Where it breaks: when the users don’t think in data models. A field-service technician doesn’t want to choose between eight views; they want today’s jobs, in order, with directions. Flexibility you have to configure is work you’ve handed to the customer.
Plausible Analytics: a dashboard that fits on one page
Task: understand how a website is doing without becoming a data analyst.
Context: site owners who want answers in minutes, not a reporting project.
Decision: put the important numbers on a single page and make them clickable. Plausible describes its dashboard as all the important stats on one page. Clicking a metric, such as a traffic source or a country, adds it as a filter, and filters stack: source, then country, then goal. Active filters show at the top, each with its own remove button. There’s a public live demo of Plausible’s own site, so anyone can try the dashboard with real data before signing up.

Trade-off: a one-page dashboard can’t answer every question a specialist might ask. It deliberately doesn’t try to.
Lesson: most dashboards fail by showing everything at once. Decide the few questions your users actually ask, answer them on one screen, and let people drill down by clicking what they’re looking at. A public demo with real data is also a very honest onboarding.
Where it breaks: in products whose users need deep, specialist analysis. A one-page summary is a starting point for an analyst, not the end. Know which of those two people you’re designing for before you cut the dashboard down.
Stripe Dashboard: making it obvious which money is real
Task: check payments, issue refunds and investigate problems, where a mistake involves real money.
Context: finance, support and engineering teams, some of whom also test integrations with fake data.
Decision: separate test data from live data, and make every payment’s history visible. Stripe provides test mode and sandboxes for testing payments without moving real money. Sandboxes can be accessed through the account picker; keep the active environment visible when reviewing records or taking actions. A payment’s details page includes a timeline of what happened to it, such as the refund, and a refund reason of “Other” requires a note.
| Pattern to study | Boundary to preserve |
|---|---|
| Distinguish live and testing environments | Verify the active environment and its settings before taking an action; test mode and sandboxes are distinct testing options. |
| Show payment and refund history | Make payment status, refunds and event history easy to distinguish. |
| Provide context for a refund | Follow the actual refund workflow and required fields; permissions and account configuration still apply. |
Trade-off: clear separation adds a step: switching environments is deliberate, not instant. For a product where confusing test and live data could cost money, that friction is the point.
Lesson: in high-stakes products, the most important design question is often “which data am I looking at?”. Make the answer impossible to miss. And when something happened to a record, show the history. A timeline answers support questions before they’re asked.
Where it breaks: in low-stakes products where the separation is overkill. A notes app doesn’t need sandboxes. The lesson is proportion: the more a mistake costs, the more obvious the boundary between real and practice should be.
GitHub pull requests: explaining why you can’t
Task: review and merge code changes safely, with several people and automated checks involved.
Context: teams where merging a broken change can take a product down.
Decision: let teams set rules, and make the product explain them at the moment they bite. Branch protection and rulesets can require approvals, code-owner reviews and passing status checks before a merge. Reviewers submit a review as Approve, Request changes or Comment, and a changes-requested review can block merging when the configured protection requires it. The merge box groups checks by status, with failing ones first, so the reason for a blocked merge sits right where you’d click.
| Review or merge state | What determines its effect |
|---|---|
| Comment | Feedback without an approval decision. |
| Approve | Whether it satisfies a requirement depends on reviewer eligibility and configured rules. |
| Request changes | Can block merging when configured protection requires it; not a universal block for every repository. |
| Failing check or missing approval | Explain the applicable requirement beside the merge action and provide a route to inspect it. |
Trade-off: rules slow people down. That’s the point, but it only works if the rules are visible. A grey button with no explanation is a support ticket waiting to happen.
Lesson: permissions and rules are part of the interface, not a settings page. When someone can’t do something, tell them why, what’s missing and who can fix it, right next to the control they tried to use.
Where it breaks: when the rules are invisible or arbitrary. If users can’t tell who set a rule or how to get an exception, the explanation becomes an argument. Rules need an owner people can reach.
Recognise these problems in your own web app?
A UX audit shows which flows, states and messages cause the most friction, with evidence, not opinions.
Figma: showing who else is here
Task: design together, in the same file, at the same time.
Context: designers, developers and product people working on the same thing, often remotely.
Decision: make other people visible. Collaborators appear as named cursors on the canvas and avatars in the toolbar. Following a collaborator lets you see their view; Spotlight lets a presenter bring collaborators along. Comments can be pinned to the canvas or attached to a frame or layer. Comments linked to a frame can move with it; a canvas-pinned comment does not automatically follow a moved frame. Cursor chat shows temporary messages by the cursor and keeps no message log; use comments for feedback that must remain available.

Trade-off: presence is powerful and can be distracting. Figma lets people hide other cursors, which admits that sometimes you just need to work.
Lesson: in collaborative products, “who else is here and what are they doing?” is a core question. Attach feedback to the thing it’s about, not to a separate thread. But don’t add real-time collaboration just because it’s impressive. If your users don’t work on the same thing at the same time, it’s expensive decoration.
Where it breaks: in products where people work alone, or one after another. A document signed by one person, then another, needs clear handover states, not live cursors.
Google Docs: never making you wonder if it saved
Task: write and edit documents, often with other people, without losing work.
Context: everyone, from students to legal teams, on unreliable connections and shared files.
Decision: make the system state visible and make changes reversible. A visible save status tells the user whether changes have been saved. Suggesting mode lets people propose edits that owners accept or reject, one at a time or all together. Version history shows earlier versions, lets you name important ones and restore an available earlier version when you have edit access.
| Document pattern | What the interface should explain |
|---|---|
| Saving and saved status | Show save completion clearly and separate it from the available recovery options. |
| Suggestions | Proposed edits remain separate from accepted changes, subject to access rights. |
| Version history | Make available versions and restore permissions clear. |
Trade-off: suggestions and versions add concepts people have to learn. For casual users, most of it stays invisible until they need it, which is the right way round.
Lesson: people trust a tool when they know the state of their work. Show saving and saved. Separate “propose” from “change” when several people edit the same thing. And give people a way back: version history is the undo button for the whole document.
Where it breaks: in records that must not be edited quietly, like signed contracts or submitted tax returns. There, suggestions and versions need an audit trail and approvals, not just a friendly history panel.
Gmail: a few seconds to take it back
Task: send, sort and clear a lot of email quickly.
Context: high volume, frequent repetition and one very irreversible action: sending.
Decision: add a grace period to the scariest action. After sending, a “Message sent” notice with Undo appears, and the cancellation period can be set to 5, 10, 20 or 30 seconds. For volume, bulk selection works across the page, then across the whole conversation list, with clear wording about what’s selected. Keyboard shortcuts cover most actions once they’re switched on in settings.

Trade-off: undo delays the send by a few seconds. The short cancellation window gives the sender a chance to correct an immediate mistake.
Lesson: you can’t always make an action reversible, but you can often delay it for a moment. Undo is kinder and faster than a confirmation dialog nobody reads. And when an action touches many items, say exactly how many before it happens.
Where it breaks: when an action triggers something outside your control immediately, like a bank transfer or a notification to a thousand people. Then undo has to become a review step before the action, with the consequences spelled out.
GOV.UK services: forms that get it right the first time
Task: complete a government form correctly, often once in a lifetime, often under stress.
Context: the whole population, including people with disabilities, low digital confidence or limited time, on any device.
Decision: simplify each step and design errors properly. The GOV.UK Design System recommends starting with one thing per page. When something goes wrong, an error summary appears at the top, linking to each problem field, and each field also shows its own error message. Focus moves to the summary and the page title starts with “Error:”, so screen reader users hear it straight away. The design lesson here is the error pattern: summary links, field-level messages and an explicit focus destination.

Trade-off: one question per page means more pages. For a form someone fills once, that’s worth it. For a data-entry screen an expert uses 50 times a day, it would be torture.
Lesson: the GOV.UK Design System is one of the best free lessons in form and error design there is. Borrow its error patterns almost anywhere. Borrow one-thing-per-page only for infrequent, high-stakes tasks.
Where it breaks: in expert tools with dense, repeated data entry. There, one question per page turns a two-minute job into ten. Keep the error patterns; drop the pagination.
Calendly: respecting where the other person is
Task: let someone book a time with you without an email back-and-forth.
Context: the invitee doesn’t have an account, may be in another country and is often on a phone.
Decision: design the flow for the guest, not the host. The booking page detects the invitee’s time zone and shows times in it, with a dropdown to change it. Hosts can lock the time zone for in-person events, where showing local time elsewhere would be misleading.

Trade-off: automatic detection can be wrong, for example when someone’s travelling. That’s why the time zone is visible and editable, not hidden.
Lesson: in two-sided products, the person without an account is often the one who decides whether the flow works. Remove the mental maths, show your assumptions and let people correct them.
Where it breaks: when the time zone isn’t the only hidden assumption. Currencies, units and date formats need the same treatment: detect sensibly, show clearly, let people change it.
Xero: suggestions you confirm, automation you can check
Task: match bank transactions to invoices and bills, which is the job that keeps accounts correct.
Context: small business owners and bookkeepers, where a wrong match means wrong accounts.
Decision: let the software suggest and the person confirm. In Xero’s bank reconciliation, statement lines sit on one side with a suggested match on the other, and you click OK to confirm it; other ways to find a match are there when the suggestion is wrong. Xero’s JAX automatic reconciliation is rolling out in beta to eligible organisations. It reconciles high-confidence suggestions and leaves other lines for manual review; availability depends on the organisation and plan.

Trade-off: confirming every line is slow for high volumes; automating everything is risky if nobody checks. Showing what was automated, and what wasn’t, is the bridge.
Lesson: when you add automation or AI to a high-stakes task, don’t hide the work. Show what the system did, let people review it and make it easy to turn off. Trust comes from being able to check.
Where it breaks: when the suggestions are often wrong. Then confirming each one becomes a chore, and people start clicking OK without reading. Automation you can’t trust is worse than none, because it trains people to stop checking.
Vercel: status you can see from across the room
Task: deploy code and know whether it worked.
Context: developers pushing changes many times a day, where a failed build can block a release.
Decision: give every deployment a clear status and a place to look. With Vercel’s Git integration configured, non-production branch pushes can create preview deployments with their own URLs for checking changes before release. Deployments show a status (queued, building, ready, error, cancelled), with an animated dot while work is in progress. Build logs are one click away from the deployment.

Trade-off: preview environments for every change cost infrastructure. For teams that ship often, catching a problem before production is cheaper.
Lesson: long-running processes need visible states. Queued, working, done, failed: each should look different, and “failed” should link directly to the reason. A spinner with no end is not a status.
Where it breaks: when states are too technical for the audience. “Build error” means something to a developer. For a customer, the same moment needs plain words and a next step.
Trello: simple enough to start in a minute
Task: organise work into stages and move it along.
Context: anyone from a family planning a move to a team running a campaign, often with no training at all.
Decision: one metaphor, carried all the way through: boards, lists and cards you drag between them. The 2025 redesign added an Inbox for capturing tasks from email and chat tools and a Planner that connects to your calendar, so cards can be dragged into time slots.

Trade-off: a simple board model gets stretched when teams need dependencies, reporting and complex workflows. Simplicity is a choice about who you’re for.
Lesson: a familiar metaphor can replace a lot of onboarding. If people understand the model in a minute, you’ve saved them hours. Just be honest about when your users will outgrow it.
Where it breaks: when the work has real structure, like dependencies, approvals and strict order. A board where anything can go anywhere is freedom for a small team and chaos for a regulated process.
Jira and the Atlassian Design System: keeping a big product coherent
Task: keep a large, long-lived product family consistent while it keeps changing.
Context: several products, many teams, millions of users and a navigation that had grown over years.
Decision: one shared design system, and a navigation rethought across products. The Atlassian Design System provides shared foundations, such as colour, type, tokens, icons and accessibility, across Atlassian’s apps. In 2025, Atlassian rolled out a new navigation for Jira, Confluence and other apps: a simpler top bar with search and Create, and a customisable, collapsible sidebar. Inside a space, navigation moved to horizontal tabs. Current Jira documentation uses “work items” and “spaces”; use the terminology visible in the version your team is reviewing.

Trade-off: changing navigation and terminology in a product people use daily is painful, even when the result is better. Every moved button is a support question for a few weeks.
Lesson: at scale, consistency isn’t something you can keep by being careful. It takes a design system, with shared foundations, components and rules, plus the governance to change them. And when you change a big product’s navigation, do it once, properly, across the whole family, rather than one screen at a time forever.
Where it breaks: when a small product copies an enterprise design system. A two-screen app doesn’t need governance committees and a token hierarchy; it needs a small, consistent set of components. Scale the system to the product, not to the company you admire.
Several teams, one product that should feel like one product?
We turn interface decisions that work into shared foundations, components and rules your teams can keep.
Tables and data-heavy screens
Several examples above are really about tables, even when they don’t look like it. Airtable is a table with opinions. Stripe’s payments list, Linear’s issue views, Xero’s reconciliation screen and Jira’s backlogs are all tables that people scan, filter, sort and act on all day.
What the good ones share:
- Filters that are visible and removable. Plausible shows every active filter at the top with its own remove button. For any product, check whether a shared link preserves the intended view and which access rules still apply. Nobody should wonder why half the data has disappeared.
- Saved views for repeated questions. If people ask the same question every Monday, let them save it.
- Bulk actions with clear scope. Gmail says exactly how many conversations are selected, on this page and in total, before anything happens.
- Row detail without losing your place. Opening one record shouldn’t throw away the list, the scroll position and the filters.
- Density that fits the user. Experts scanning hundreds of rows want density. Occasional users want fewer columns and more explanation.

Most web apps we audit have at least one table that was designed for the demo: twelve rows, no filters, no empty state. Then real customers arrive with 40,000 rows and the table becomes the product’s biggest support topic.
How the examples teach new users
The examples also show ways to teach within a task, alongside any tours or onboarding they may provide.
- Start from something. Notion’s new pages offer ways to begin. Plausible’s public demo shows real data before you’ve installed anything.
- Use a familiar model. Trello’s boards and cards need almost no explanation, because people have used sticky notes on a wall.
- Make the next step obvious. Calendly’s guest sees times and nothing else to decide first.
- Put help where the question arises. Linear’s command menu makes actions available in the current work context. GitHub explains a blocked merge at the merge button.
The pattern is the same everywhere: teach at the moment of need, inside the task, not in a slideshow before it. Keep guidance close to the action it explains, and make blocking errors useful even when a user skipped onboarding.
What the 15 examples have in common
Put the examples side by side and a pattern appears. None of them is great because of its colour palette. They’re useful because each one made a clear decision about a specific task and then carried that decision through every state of the product.

They design for the task, not the screen. Linear designs for speed through a backlog. GOV.UK designs for getting a form right the first time. Xero designs for matching money correctly. Each product’s “best screen” is the one where its most important task happens.
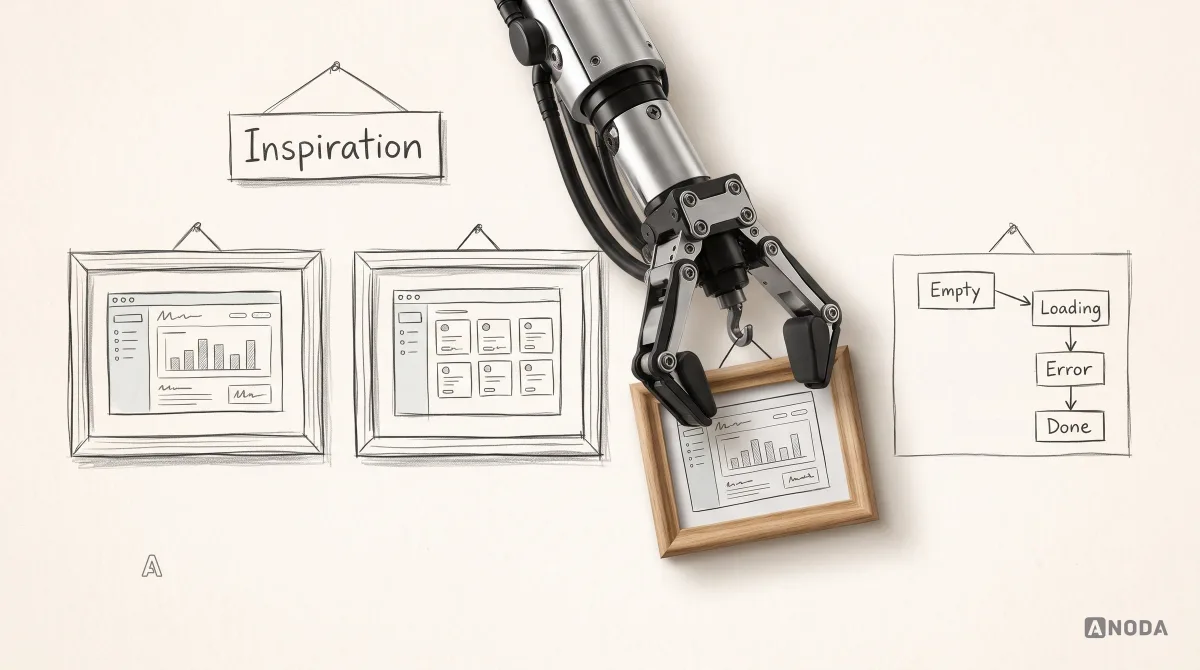
They treat states as first-class design. Empty, loading, saving, error, blocked, done. The examples above tell you what’s happening at every step. Most weak web apps are only designed for the happy path with perfect demo data, and fall apart the moment reality turns up.

Look at how the examples handle each state:
- Empty: Notion offers ways to start a page. Plausible lets you explore a live demo before your own data exists.
- In progress: Vercel animates the status while a build runs; Google Docs shows that it’s saving.
- Done: Gmail confirms the message was sent, and still offers Undo.
- Blocked: GitHub lists what’s missing before a merge.
- Failed: Vercel links an error to its logs; GOV.UK lists every problem at the top and next to each field.
- Needs attention: Xero separates what was matched automatically from what still needs a person.
A useful exercise for your own product: take your most important screen and draw it in all seven states. Most teams find at least three they’ve never designed. Those are exactly the states your customers see on their worst day, when they’re most likely to give up, call support or cancel.
They make consequences visible before they happen. GitHub shows why a merge is blocked. Stripe shows you which data you’re looking at. Gmail gives you seconds to take a message back. When an action is hard to reverse, good products either explain it first or give you a way back.
They respect repetition. Keyboard shortcuts, bulk actions, saved views, sensible defaults. When someone does a task 200 times a week, saving two clicks is worth more than any animation.
They stay consistent. The same component behaves the same way everywhere. That’s not an aesthetic choice; it’s what lets people learn the product once instead of on every screen. At scale, it takes a design system to keep it that way.
Permissions: designing for who can do what
Almost every serious web app has roles, and almost every weak one hides them in a settings page. The examples show a better approach: treat permissions as part of each screen.
GitHub explains a blocked merge where you try to merge. Airtable lets someone lock a view so a colleague can’t accidentally rearrange it. Stripe keeps practice and real money in separate environments with their own access. In each case, the user learns the rule at the moment it matters, from the screen they’re on.
The common failures are predictable. A button that simply isn’t there, so the user can’t tell whether the feature doesn’t exist or they aren’t allowed. A button that’s there, clickable and then fails with “Access denied”. An admin panel that shows everything to everyone because roles were “phase two”. Each one turns into support tickets, and some turn into security incidents.
The fix is a short list of decisions made early: which roles exist, what each one can see and do, what a blocked user sees instead, and who they can ask. Designing that is cheaper than explaining it later, one confused customer at a time.
Accessibility and responsive behaviour are part of the task
Two dimensions don’t fit neatly into any single example, because they belong in all of them.
Accessibility. A web app someone can’t use with a keyboard, a screen reader or text zoom is a web app with a locked door for part of its users. The GOV.UK example shows what it looks like when accessibility is built into the patterns rather than audited in at the end: labels that are always visible, errors that are announced and linked, focus that moves somewhere sensible. For many web apps, keyboard access is not only an accessibility feature. It’s also the power-user feature. Linear and Gmail prove the same investment serves both.
| Accessibility question | Verification needed |
|---|---|
| Can people identify and operate the controls? | Inspect labels, keyboard operation, focus visibility and order in the implemented interface. |
| Can people find and recover from errors? | Test field association, error summary links and announcements with relevant assistive technology. |
| Does content remain usable when enlarged? | Test zoom and reflow at the required sizes, including content and controls. |
| Can people distinguish content and states? | Measure actual contrast and provide information beyond color alone. |
ANODA builds accessibility into the task: clear controls, useful errors and interfaces people can use across supported devices.
Responsive behaviour. Most complex web apps are used on large screens, but not only there. The approval on the train, the quick check between meetings, the calendar booking from a phone. Good responsive design isn’t the desktop layout squeezed. It’s deciding which tasks matter on a small screen and designing those properly. Calendly’s invitee flow works on a phone because most people booking a meeting aren’t at a desk. For bank reconciliation, decide from the actual users and context which review and approval tasks need phone support.
| Task | Evidence for responsive scope |
|---|---|
| Review and approve | Identify devices used by authorized reviewers and test the information needed for a safe decision. |
| Book a time | Check the invitee’s device, timezone, input and confirmation behavior. |
| Check status | Preserve meaningful status and next steps across supported screen sizes. |
| Reconcile transactions or build reports | Investigate actual mobile and tablet needs before excluding these tasks; test data density, input and access requirements. |
ANODA designs the mobile experience around the useful task, so your customers can act on the move without wrestling with a shrunken desktop.
What you can borrow, and what you can’t
Every example above made its decisions for a specific user, task and scale. Some lessons transfer almost anywhere. Others only work in the right context.
Usually safe to borrow:
- Clear system status: saving, saved, failed, and what to do next.
- Undo for actions people often regret.
- Explaining why something is blocked, next to the blocked control.
- Empty states that show what to do first.
- Error messages that say what went wrong and how to fix it.
- Consistent components and behaviour across the product.
Borrow only if your context matches:
- Keyboard-first design and command menus: great for daily power users, invisible to occasional ones.
- Infinite flexibility (blocks, custom views, fields): great for people who want to build their own system, overwhelming for people who just want the job done.
- Real-time collaboration: essential when people work together at the same time, unnecessary cost when they don’t.
- Dense, data-heavy tables: right for experts who scan and compare, wrong for first-time users.
- One question per page: right for infrequent, high-stakes forms, slow for repeated data entry by experts.

The fictional example shows why context matters: a long list on a desk does not make two jobs the same. ANODA adapts the principle to the people and decisions behind your product, rather than importing another company’s interface.
Copying a pattern without its context is like fitting a racing seat to a family car because it looked good in the pit lane. It’s a very good seat. It’s in the wrong car.
Mistakes teams make when copying examples
We see the same copying mistakes in almost every web app we audit.
- Copying the dashboard, not the questions. A beautiful analytics screen from a product whose users ask completely different questions.
- Copying the density. An expert tool’s dense tables in a product for occasional users, who then need a training session to find the export button.
- Copying the navigation of a product ten times bigger. A sidebar built for fifteen areas in an app with four. The empty space still needs designing, testing and maintaining.
- Copying the happy path only. The gallery showed the full state, so nobody designed the empty, loading or error states.
- Copying the vocabulary. Using “workspaces”, “spaces” or “hubs” because a famous product does, when your users call the same thing “clients”.
Each of these costs money twice: once to build, and again to fix when customers struggle. Copying feels cheap because the design time is short. The bill arrives later, in support, churn and the redesign.
How to study a web app example yourself
When you find a web app you admire, don’t screenshot the dashboard. Use the product like a user and write down what you find.
- Do the core task end to end. Sign up, get to the first useful result, and time it.
- Break it on purpose. Leave fields empty, enter wrong data, disconnect the network, try an action you shouldn’t be allowed to do.
- Look at the empty states. A new account shows how the product teaches.
- Try the keyboard. Can you complete the task without a mouse?
- Change the window size and zoom. Does the task survive a narrow window and 200% text?
- Find the irreversible actions. How does the product protect you from them?
- Read the help docs. Documented behaviour tells you what the team designed deliberately.
- Write down the decision, not the look. “They show the save status next to the title” is useful. “Nice colours” is not.

Then ask the most important question: does my user have the same task, the same context and the same stakes? If yes, borrow the principle. If not, design your own answer to your own problem. That’s harder than copying, and it’s the only version that works.
Why ANODA designs the workflow behind the screen
Your customers should not pay the price of a borrowed interface. ANODA connects research, roles, task flows and the states that appear after the demo, so the experience stays useful when real work begins. These projects show that approach across mortgage operations, SaaS and education.
Related ANODA web app cases
For a workflow-focused example, see Sail’s mortgage CRM design. Use the case to study how operational work connects across screens rather than copying a dashboard in isolation.
For a product spanning multiple surfaces, see SEOSpace’s SaaS redesign: a web app, a Squarespace extension and landing pages share a design system while serving different tasks.
For a role-based education product, see AispireMe’s web app design. Its domain and competitor research, role flows and prototype show the steps between understanding the product and designing the interface.
How we use examples on real projects
On client projects we use examples like these every week, but never as a shortcut to a finished design. We use them to name a decision and to argue about it with evidence.
A typical conversation goes like this. The client says: “We want it to feel like Linear.” We ask what that means for their users. Usually it means “fast”, sometimes “calm”, occasionally “dark mode”. Then we look at the task. If their users are accountants reconciling a month of transactions twice a year, keyboard shortcuts won’t make them faster. A clear review screen with good defaults will.
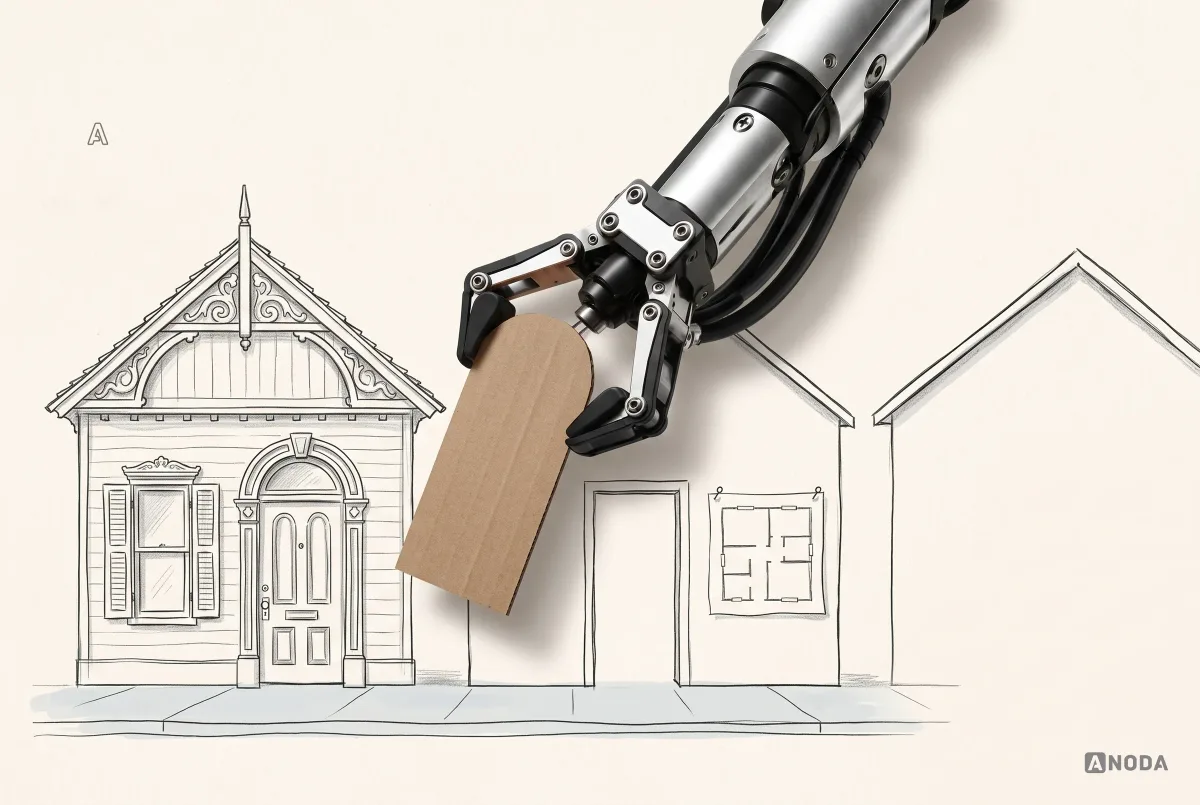
So we take the principle, speed through the frequent task, and design it for the actual task. Sometimes the result looks nothing like the example that inspired it. That’s usually a good sign.
If you’re planning a new web app, or your existing one has outgrown the screens it started with, that’s the work we do in web app design: mapping the tasks, the states and the edge cases first, then designing an interface that fits your users rather than someone else’s.
The decision rule
Judge a web app example by the task it serves, not by how it looks in a gallery. Find the user, the task and the stakes. Look for the decision that makes that task easier, check it in every state, and note what it costs. Borrow the principle when your context matches, and adapt it when it doesn’t.
A web app that looks good in a screenshot and fails on day 40 isn’t a good example. A plain one that gets the job done, recovers from errors and tells people what happened is. Those are the ones worth studying.

Your web app should be an example worth studying.
We map your users’ tasks, states and edge cases, then design a web app that works on day 40, not just in the demo.
Documentation for these patterns
- GOV.UK error summary
- Xero automatic bank reconciliation
- Vercel Git deployments
- GitHub pull request reviews
- Notion database views, filters and sorts
- Airtable view types and collaboration
- Plausible dashboard filtering
- Linear issue actions
- Linear issue creation
- Linear triage
- Gmail send cancellation
- Google Docs suggestions
- Google Docs version history
- Calendly time zones
- Stripe testing
- Stripe refund workflow
- Figma spotlight
- Trello Planner
- Trello Inbox
- Trello 2025 update
- Jira navigation
- Notion writing and editing
- Notion slash commands
- Plausible documentation and live demo
- Figma cursor chat
- Atlassian design tokens
- Atlassian typography
- Linear filters
- Linear saved views
- Gmail keyboard shortcuts
- Gmail selection scope
- Figma comment attachment
- Stripe payment timeline
Written by