
In this article
- The Power of Dashboards in Business
- Dashboard Design: A Balance Between Aesthetics and Functionality
- Dashboard Types and Their Importance
- Key Features of Effective Dashboards
- Examples of Great Dashboard Designs
- How to Beautify Your Dashboard
- Best Practices for Dashboard Design
- Monitoring Business Performance with Dashboards
- Why ANODA connects the dashboard to the work
- Build a dashboard people can act on
A dashboard that looks impressive but leaves your team exporting to spreadsheets is costing you twice: once to build the interface and again every day users work around it. When the important change is buried among equal-looking charts, decisions slow down and the operational problem keeps growing. Adding another widget rarely fixes the hierarchy.
ANODA starts with the decision each role needs to make. We connect the metric, its context and the next action, then design the layout and states around that journey. You get a dashboard that helps people do their work instead of another reporting surface they have to interpret.
The Power of Dashboards in Business

Source: FREEPIC
Businesses rely heavily on dashboards to monitor and manage key metrics. A comprehensive business overview is crucial for understanding performance and making informed decisions. A well-designed dashboard offers high data democratization, where key metrics visualization enables teams to interact with data in real-time, without needing a deep technical background.
A dashboard also provides data analysts with specific tools to analyze both qualitative and quantitative data for accurate decision-making. Whether monitoring business performance, tracking fiscal performance, or analyzing a health chart, a dashboard makes trends, exceptions and the information behind business targets visible in one place.
Source: ANODA
Dashboard Design: A Balance Between Aesthetics and Functionality
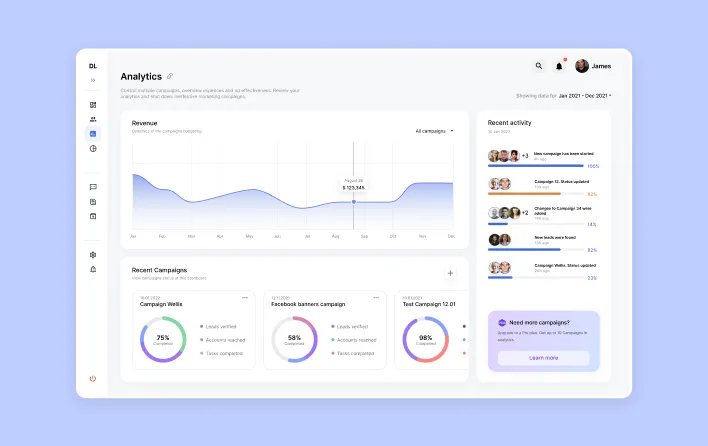
To craft a good dashboard design, it’s essential to maintain a balance between functionality and visual appeal. A clear user interface (UI) gives the most important decision visual priority. Use typography, spacing and colour to distinguish the metric, the comparison that gives it meaning and the action users can take. Gradients and shadows can support the brand; hierarchy makes the dashboard useful.
Key elements such as a solid layout, modular widgets, and visible filter context can make the dashboard more usable and adaptable across different platforms, especially on mobile devices. A responsive design ensures that the dashboard layout remains functional and aesthetic across major browsers and devices.
Dashboard Types and Their Importance
Source: FREEPIC
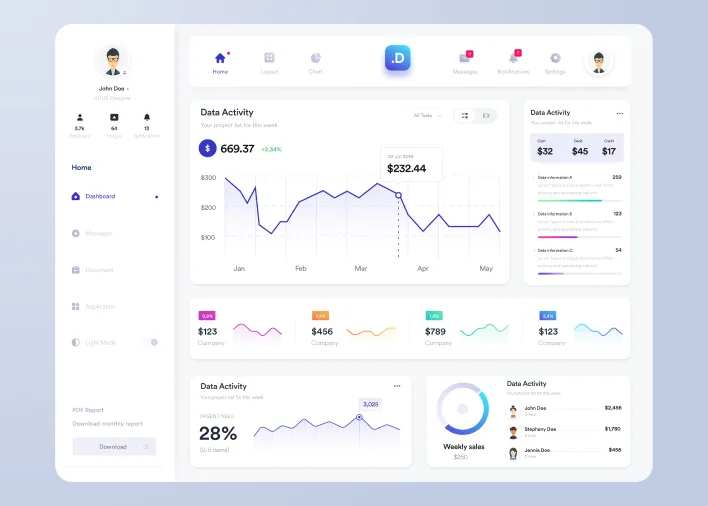
Different types of dashboards serve different purposes. Dynamic dashboards allow real-time data visualization, adjusting as new data streams in, providing insights at a glance. Analytical dashboards provide deep data dives, allowing users to investigate trends over a specific period. These dashboards are built with reusable UI components to ensure that they can be adapted and customized over time.
In a to do dashboard, for example, the user can easily manage tasks, track progress, and monitor deadlines. This type of dashboard is often used by managers who need to keep an eye on various tasks in business environments.
Recommended reading: Crafting an Effective Mobile Dashboard
Key Features of Effective Dashboards
An effective dashboard must present the most important information in a way that is easily digestible. Here are some features to consider when designing a dashboard:
- Data Visualization: Use chart types and graphs to present high-level data.
- Filters: Enable users to interact with data and view specific data sets.
- Dashboard Layout: Keep the dashboard layout organized with modular widgets for easy data access.
- Customization: A customizable dashboard allows the user to tailor the experience to their needs, highlighting their defined key metrics.
- User Interface (UI): A super clean, intuitive UI can improve the overall dashboard UI experience.
Examples of Great Dashboard Designs
Source: ANODA
Some of the best dashboard design examples come from platforms like Google Analytics, which provides real-time insights into website traffic and user behavior. By offering a customizable dashboard, Google Analytics ensures that users can view specific data and key metrics in a visually appealing way.
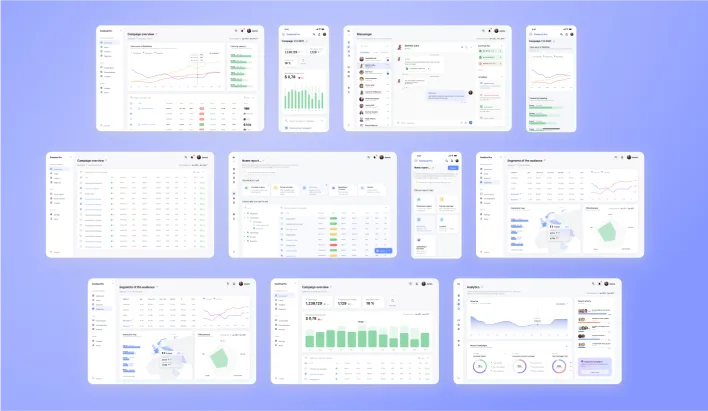
In Vecna CaseFlow, ANODA designed the desktop console for operations and site leads around robot setup, floor heatmaps, charts and alerts. The handheld picker workflow had a different job: scanning and acting during a shift. The useful dashboard is the one organised around its operator’s decision, not a resized copy of another role’s screen.
How to Beautify Your Dashboard
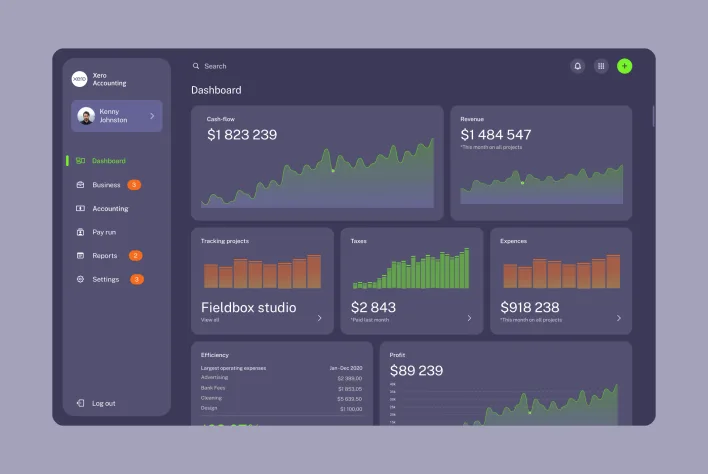
Source: ANODA
If you’re wondering, “How can I make my dashboard look pretty?” here are some steps to follow:
- Focus on Layout: A solid layout with well-organized sections ensures that the user can navigate the dashboard easily.
- Color Scheme: Utilize a consistent color combination that is easy on the eyes but still engaging. Avoid overly bright or clashing colors.
- Icons and Visualizations: Including icons and different visualizations like pie charts or bar graphs can add variety and make the dashboard more interactive.
- Consistency Across Screens: Whether on mobile devices or desktop, ensure your dashboard maintains its responsive design. Test across major browsers to ensure compatibility.
By adhering to these principles, you can create a beautiful dashboard that not only looks good but is functional for users and businesses alike.
Best Practices for Dashboard Design
When designing a dashboard, there are a few practices to follow to ensure both functionality and aesthetics:
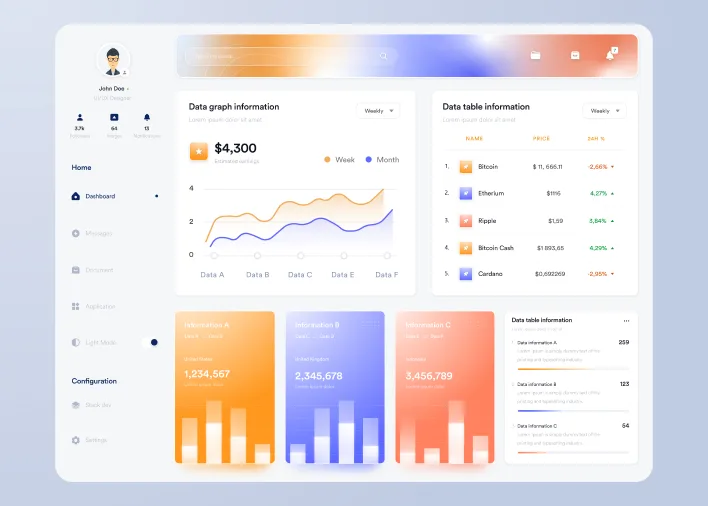
- Keep It Simple: A clean interface makes it easier for users to focus on the most important information.
- Make Freshness Visible: Show when the data was updated and distinguish loading, stale, empty and failed states. Use live updates where the operational decision needs them.
- Think About the User: Design the user interface with the user in mind. Customizable dashboards that allow users to adjust settings or focus on certain key metrics will enhance user satisfaction.
Source: FREEPIC
Explore ANODA’s Vecna CaseFlow design work for a concrete operational-dashboard example.
Monitoring Business Performance with Dashboards
Incorporating dashboards into your corporate websites or applications can significantly improve your ability to monitor and manage business performance. By providing a comprehensive business overview, dashboards allow you to make informed decisions based on high-quality data.
These tools allow data analysts to delve deeper into specific data, enabling accurate and timely decisions. Flexible layouts keep the relationship between metric, comparison and action clear as the user changes filters or moves to another device.
Why ANODA connects the dashboard to the work
A generic grid treats every metric as equal and every role as the same user. ANODA maps the decisions, designs the drill-down and action paths, and keeps filter context and data states visible throughout. Your team gets a clear interface direction, detailed flows and reusable patterns that make the next feature easier to design and build.
That is how the dashboard becomes a working part of the product: users see what needs attention, understand why and take the next step in the same flow.
Build a dashboard people can act on
A well-designed dashboard brings together defined key metrics, dynamic dashboard features, and a clean interface to deliver an all-in-one solution for businesses to track performance. With dashboard design examples from platforms like Google Analytics, you can craft a dashboard that is not only beautiful but highly functional for all types of users.
Whether you’re building a dashboard for mobile devices, or desktop applications, the key is to maintain a progressive design, ensure easy access to high-level data, and offer users flexibility through customizable dashboards.
By applying these dashboard design principles, you’ll be able to create dashboards that deliver crucial information, are visually appealing, and help businesses achieve their realistic targets effectively.

Source: FREEPIC

Dashboard design
Your users should act on the data, not fight the dashboard
Show ANODA the metrics and decisions your team works with. We will turn the clutter into clear priorities, connected drill-downs and actions users can find.
Frequently asked questions
What makes a dashboard "beautiful"?
A beautiful dashboard combines aesthetics and functionality. This includes a well-organized dashboard design, intuitive features, and a visually appealing layout that enables users to interact seamlessly with the data.
How can I choose the right dashboard type for my needs?
The ideal dashboard type depends on the purpose. For data analysis, use an analytical dashboard. For monitoring tasks at a glance, a dynamic dashboard is best, and the roles and actions determine the layout.
What elements should a good dashboard design have?
A good dashboard design includes a clear top bar, intuitive visualizations, and responsive layout across different devices. It also provides users with a customizable interface to view key data points easily.
How does a dashboard enable users to control tasks?
Dashboards often include task management tools that allow users to monitor and control various tasks in real time. Through task-based visualizations, users can see the total running time of ongoing projects and their progress.
How does ANODA approach dashboard design?
ANODA starts with each role’s decisions, connects key metrics to comparison and action paths, and designs the layout, filter context and data states around that work.
How can I improve my dashboard’s top bar?
The top bar of your dashboard should be clean and minimal, offering quick access to important controls and settings. It should help users navigate through pages, tasks, and specific sections of the dashboard with ease.
How do visualizations enhance a dashboard?
Visualizations transform complex data into easy-to-understand charts, graphs, and diagrams, allowing users to interpret information at a glance. Effective dashboard designs use various visualizations to present both high-level and detailed data insights.
How can I track tasks on my dashboard at a glance?
A well-structured dashboard allows users to track ongoing tasks and deadlines at a glance, with clear visual cues for progress and task completion times.
What screen size works best for a dashboard?
A responsive dashboard design ensures compatibility across all screen sizes, from desktops to mobile devices, ensuring that users can interact with the dashboard efficiently on any device.
Can you provide an example of a well-designed dashboard page?
An example of a well-designed dashboard page features intuitive navigation, real-time updates, visually appealing charts, and a user-friendly layout, ensuring users can access important data with ease. ANODA’s Vecna CaseFlow design work is a concrete example of arranging operational information around the decisions its users need to make.
Written by